I love this. Photosynthesis is pretty great.

Showing posts with label plants. Show all posts
Showing posts with label plants. Show all posts
Thursday, June 8, 2017
Tuesday, June 9, 2015
Vampire Plants: Sucking Life into the Community

I would like to introduce you to the yellow rattle (Rhinanthus minor). This little plant has pretty yellow flowers that belie a dark secret: it is a vampire plant. Okay, technically, it is a hemiparasite. The yellow rattle has green, photosynthetic leaves to make its own food, but its roots latch onto those of nearby plants to steal their water and nutrients. See? Vampire. I guess you could say that it hasn’t gone full parasite. So what’s wrong with a little leaching of material from your neighbor? Must be like stealing cable, right? Well, not exactly. Hemiparastitic plants can have impacts that are highly disproportionate to their small size. By stealing water and nutrients, they reduce the host plants’ photosynthetic rate and biomass, making them less competitive in their habitat. When you are less competitive in a highly-competitive environment then you don’t last all that long. But this is looking at it on an individual, plant-by-plant, level. Let’s scale it up a bit.
We’ll start by following the logic trail. Hemiparastic plants are widespread in ecosystems such as meadows where they attach to dominant grasses (in this case, dominant meaning numbers). As individual grass plants are weakened or killed, overall grass biomass decreases. When the dominants are gone there is more room for other types of plants to move in, increasing species richness. More types of plants attract more primary consumers (like insects) to feed on them. More insects attract more secondary consumers, and on and on. All in all that one little plant has caused indirect community level changes. A new paper by Hartley et al. in Ecology looks at how this one little plant can affect multiple trophic levels (or levels in the food chain).
The researchers laid out 13 blocks, each containing four 1 by 1 meter plots, in a field site in Sussex, UK. Three out of those four plots were allowed to be naturally colonized by yellow rattle. These “infected plots” were then randomly assigned to one of three treatments: yellow rattle removed, present, or enhanced. Then, during maximum vegetation and invertebrate abundance, plots were censused. Counts, ground cover, vegetation height, and species richness were measured for plants. Invertebrates were sampled with a Vortis suction sampler (a.k.a. bug vacuum) and hand counts. They were identified and classified into their trophic levels: herbivore, predator and detritivore.
They found that the density of yellow rattle had pronounced effects on the plant community. Grass cover was lower, plant diversity higher (although not richness), and plant height lower in plots where the hemiparasite was present or enhanced. Going up a trophic level, sap-feeding insects (Hemiptera) increased by 130%, caterpillars (Lepidoptera) by 217% and weevils (Curculionidae) by 188%. Whoa! Going up another level to the predators, spiders and harvestmen (Araneae and Opiliones) increased by 142% and bees and wasps (Hymenoptera) by 180%. Continuing with the whoa! Going down to the detritivore groups, wood lice (Isopoda) went up by 116% and springtails (Arthropleona) by 58%. Of course, not all animals fit into a single trophic group, but as you probably guessed by the trend you’ve been seeing, those groups went up too. Slugs and snails (Gastropoda) by 103% and mites (Acari) by 57%. That’s quite a list, but not everything increased. There were some non-significant groups including flies (Diptera), rove beetles (Staphylinidae), and springtails (Neelipleona and Symphypleona). It is also important to note that these numbers are from enhanced compared to removed plots. The present plots had increases in many of the same categories, though not as dramatic.
In scientist-speak these results showed that “the manipulation of a single sub-dominant plant species causes substantial changes in the abundance and diversity of organisms across four trophic levels in individual plots in a complex grassland community.” Basically, they demonstrated that grasses went down and just about everything else went up just by the addition of one, small and less numerous hemiparasite. This one little plant species caused striking (their term), rapid changes in the community. The less obvious effects of yellow rattle were how the effect was actually occurring. Was it on plant community composition or plant quality or stand height? The authors cite a greenhouse study that showed insects to prefer parasitized to unparasitized grasses when given the choice. Add to that that it is known that parasitic plants impact nutrient cycling, especially enhancing the nitrogen content of vegetation overall. This suggests that it may be plant quality that is the driving mechanism. So the observed, large increase of sap-sucking invertebrates, particularly the Hemiptera, with altered plant quality makes sense as does the increase in detritivores with newly nutrient-rich litter. At this point, perhaps you have considered the impact of these plant-attacking invertebrates as well. Good on you. They are probably themselves doing some damage on and affecting change on the plant community, but this work doesn’t go into that. Time for another study I think!
(image via Urban Butterfly Garden UK)
Wednesday, January 14, 2015
1, 2, 3 Photosynthesis!
Here's a fun little photosynthesis song. The visuals are....well, there are none. But, the song is pretty good. Very catchy.
Tuesday, September 30, 2014
A Warm Winter Legacy: Leaf Flushing and Senescence Long-Term

Fall is in the air. Here in North Carolina that means drastic temperature swings that cause me to dress incorrectly on any given day. It also means the arrival of fall colors. Indeed, fall colors are incredibly beautiful, but biologically speaking, you are watching death happen. This autumn splendor got me to thinking about these colors a little closer, specifically the phenology of trees.
Phenology is the study of the annual timing of recurring life cycle events. The timing of these events is typically influenced by seasonal environmental changes. In the case of trees, specifically hardwood forests, this is the leafing-out (flushing) and dropping-off (senescence) of leaves. But what actually triggers a plant to leaf-out? This can vary a bit by species or even individual, but there are a couple of general categories you can look to. The first is changes in air temperature, the chilling in the winter and warming in the spring. The other is photoperiod, or the day length, which often interacts with temperature, allowing plants to quickly respond to changing conditions.
Considering that these events are triggered by environmental changes, it is logical to assume that global climate change can force changes in the phenology of many species and communities. This is another think-about-the-plants moment. How plants respond to climate change has huge consequences for world ecosystems – growing seasons, species ranges, carbon and water cycling, interactions with animals, etc.
A paper published earlier this year in PNAS took a look at variations in leaf flushing and senescence dates in relation to warming. Many phonological studies focus on specific phenophases (like leaf-out in the spring), but this study is unique in that it looks at subsequent phenological events. The authors aimed to see if effects of warming lasted longer than the current growing season. To do this, in December 2009 they took seventy 3-4 year old cloned oak and beech trees and put them in growth chambers where they could very carefully control the winter environmental conditions. They manipulated the temperatures of the growth chambers to create treatment groups of winter-spring warming, winter-only warming, and spring-only warming. Then, in spring of 2010 when the flushing was complete, they moved the trees out of the chambers and into a field. The trees stayed outside and were measured until the following spring of 2011. Leaf-out rates were determined using a scale that went from undeveloped bud to unfolded leaf, and leaf senescence was recorded as the date at which half of the leaves were colored or dropped. These measurements allowed for a quantification of growing season length. Additional measurements of numbers of leaf per tree, specific leaf area, total leaf area per tree, number of buds, dry weights of various parts of the trees, carbohydrate content, and carbon and nitrogen content were taken. They also combined their data with that of the European phenology network to get both a larger sample size and a wider geographic area.
The researchers found both leaf flushing and senescence in both species to be advanced 15-18 days by winter-spring warming. In the long-term, the timing of autumn leaf senescence was found to be positively correlated with spring leaf flushing dates, and advanced leaf flushing lead to earlier leaf flushing the following year. This suggests that the physiological impacts of a warmer winter last longer than just one growing season. Advanced leaf flushing in this winter-spring-warming treatment was also associated with some physiological and morphological changes, particularly in the oaks. These included higher leaf number, higher leaf area per tree, and higher starch accumulation.
The trends of the experiment were also observed in the mature trees in the long-term field-based phenology observations of the European phenology network. The underlying cause in both cases is likely that the plants never really fulfill the winter chilling requirements necessary for them to enter dormancy. Currently, the most widely accepted mechanism for leaf senescence is the environmental control hypothesis, which proposes that leaf senescence is triggered with the unfavorable autumn season comes (changes in photoperiod, temperature, or both). This study shows that perhaps that isn’t all that’s going on.
*sigh* nothing is ever simple is it?
For lots of really great info on the science of leaf-out, I recommend this review article:
And you can contribute to leaf phenology research through Project Budburst!
Wednesday, September 17, 2014
Live Fast, Die Young: Evolutionary Outcomes of an Asteroid Impact
| Figure 1: (A) "Dryophyllum" subfalcatum, (B) unknown nonmonocot, (C) "Ficus" planicostata, (D) "Populus" nebrascensis |
As of now, it is widely accepted that an epic asteroid collision ended the 135 million year reign of the dinosaurs. The Cretaceous-Paleogene boundary (KPB) extinction event is marked by the Chicxulub (CHEEK-sheh-loob) impact on the Yucatán Peninsula in Mexico. This asteroid or comet is estimated to have been about 6 miles (10 km), releasing as much energy as 100 trillion tons of TNT that caused a crater more can 110 miles (180 km) across! This impact coincides with a mass extinction event that includes the dinosaurs. Dramatic climate swings caused by the dust kicked up into the atmosphere were likely the culprit behind many of these extinctions. Before we go further, take a second to think about what you know about this extinction event. You probably think of the mass die-off of the dinosaurs and the subsequent rise of the mammals, right? But, as I have in the past, I’ll now pose a question: What about the plants?
A new paper published yesterday in PLOS Biology asks just that question. We know that in temperate North America the Chicxulub impact resulted in the extinction of over 50 percent of the plant species. From an evolutionary and ecological stand-point, that’s a lot of competitors that were taken out of the game. However, the environment was dramatically altered as well, changing to a cold and dark “impact winter.” Combined, these factors created a unique selection scenario for certain ecological strategies. The new paper takes a close look at the functional traits associated with these strategies.
The researchers measured fossil leaf assemblages spanning a 2.2 million year interval across the KPB, assessing four differing selection scenarios for functional traits. First, wrap your head around the concept of “functional traits.” These are characteristics that define species in terms of their ecological roles. In the case of leaves, these include leaf mass per area (LMA; Do you make a big, expensive leaf or a light, cheap one?) and leaf minor vein density (VD; Do you have more veins to transport lots of water?), among many others. Because leaves are the food producers, these traits are linked to plant growth and fitness. Next, you can relate these traits to the “leaf economic spectrum” (LES) that contrasts species with inexpensive short-lived leaves with fast returns on carbon and nutrients (deciduous, angiosperm, broadleaf) to costly long-lived leaves with slow returns (coniferous, gymnosperm, evergreen). The former is typically selected for in a less resource variable environment and vice versa. From this, you can get a more global perspective on changes in species composition.
The researchers measured LMA and VD for fossil leaf assemblages spanning the KPB. To do this they digitally photographed specimens that could be measured and confidently reconstructed. Then they used Photoshop to digitally separate the leaf from its rock matrix. For LMA they used ImageJ to calculate leaf area and petiole width, and then ran these numbers through empirical scaling functions (a.k.a. equations). For VD, they used a MATLAB line-counting program to isolate the veins and then manually counted the number of vein-line intersections, computing the mean distance between veins as the sum of all line counts divided by the sum of all distances (a.k.a. a slightly less complicated equation). They ran a few scenarios to account for site and region plant specificity as well.
They found LMA to decrease and VD to increase across this time period. Even changes just these two traits reflect large physiological and biological shifts in plant functioning over a relatively short period of time. According to their data, the Chicxulub impact led to the selective extinction of species with slow strategies. This caused a directional selection away from evergreen species along with a stabilizing selection of deciduous angiosperms. The authors pose a few hypotheses in their discussion that are worth mentioning. The higher observed VD in angiosperms, and their ensuing selection, could have been driven by declining atmospheric carbon dioxide (CO2), which selects for higher hydraulic capacity. This CO2 hypothesis would, of course, not really hold water (no pun intended) for nonangiosperms and shade species, but the authors suggest that the observed increase in VD is more likely to be a direct consequence of the impact selecting for specific leaf economic strategies rather than ongoing-longer term climate change.
In this case, slow and steady did not win the race.
(image via above citation)
Tuesday, July 15, 2014
Breaking Up is Hard to Do: Photosynthesis, Water-Splitting, and the OEC
A very very cool paper was recently published online. The paper details a study that shows the first images of water splitting apart during photosynthesis. So pick you jaw up off the table and we’ll get into the nitty-gritty details.
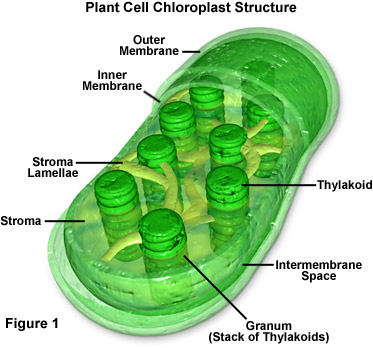 Let’s start by accessing your long-term memory, dragging out some of that basic biology information you buried after high school and grabbing on to that dusty file about photosynthesis. If you remember, plants have little green, bean-shaped energy factories in their cells called chloroplasts. These chloroplasts are filled thylakoids stacked up in grana. The thylakoid membranes contain networks of pigments, including chlorophyll, arranged in aggregates or complexes. Think of them kinda like light energy harvesters. Energy is captured for functional and structural units of protein complexes called Photosystem I (PSI) and Photosystem II (PSII). PSI is the light reaction and converts light energy to chemical energy. The pigments of the complexes each absorb light and then pass along that light energy to the central chlorophyll molecule to do photosynthesis. The energy obtained in this reaction is stored in ATP (adenosine triphosphate) and NADPH (nicotinamide adenine dinucleotide phosphate-oxidase) molecules. PSII, the dark reaction, takes place in the stroma within the chloroplast. This reaction uses the Calvin cycle to convert carbon dioxide and energy from ATP into glucose (sugar). To say that is photosynthesis put shortly and simply would be an understatement, but keep this basic reaction in mind:
6 CO2 + 6 H2O à C6H12O6 + 6 O2
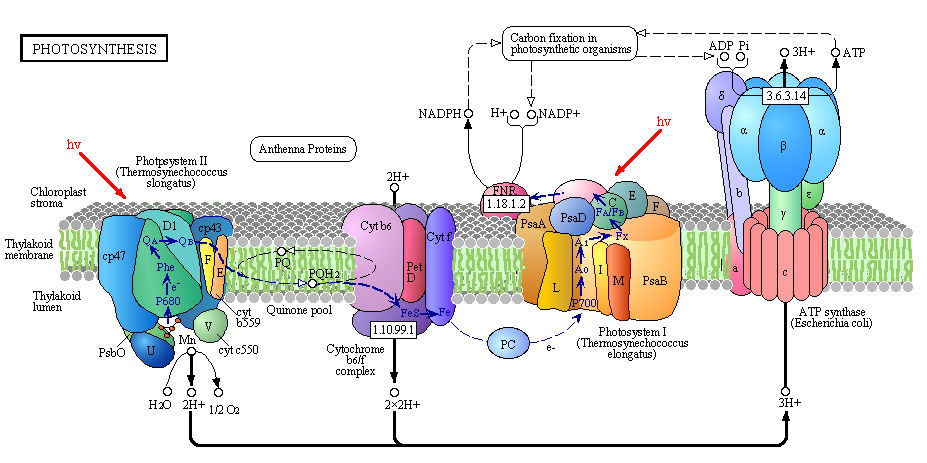
It is important to mention that in PSII, water is photochemically oxidized to dioxygen (O2) by the oxygen-evolving complex (OEC), a metalloenzyme cluster containing manganese and calcium. The OEC cycles through five photo-catalytic stages (S0-S4) in which four electrons are sequentially extracted from the OEC in four light-driven charge-separation events by a repeatedly photo-oxidized chlorophyll center (Kok cycle). This is the reaction that makes all that oxygen we breathe.
2 H2O à S0-S4 à O2 + 4 H+ + 4 e-
The new paper by Kupitz et al. (and al. and al. and al.) published in Nature looks closer (very close!) at this PSII water-splitting reaction. They had some issues to overcome if they wanted to collect more information on this reaction, mostly involving the static nature of X-ray crystallography and the damage done to the OEC with this method. Traditional X-ray crystallography enables 1.9Å resolution (near atomic) but the OEC probably suffers X-ray damage. To overcome this, the researchers used serial femtosecond crystallography. This method uses single shot diffraction patterns are collected from a stream of nanocrystals, using 120 Hz femtosecond (one millionth of a nanosecond!!) pulses from an X-ray Free Electron Laser (XFEL). The second is the quality of the structural information. These pulses are so intense that the sample/specimen is destroyed, but the pulse duration is so short that the diffraction is observed before the destruction occurs. The method produces millions of “snapshots” in hours and can collect time-resolved data for dynamic processes like water oxidation in PSII.
The researchers developed a multiple-laser illumination scheme to observe this dynamic reaction in thermophilic cyanobacterium (Thermosynechococcus elongates). They progressively excited the OEC in dark-adapted PSII nano/microcrystals by two laser pulses from the dark S1 state via the S2 state to the double-flash putative S3 state (5 and 5.5Å resolution). Believe it or not, that was their method put simply. Essentially, they were able to determine the structures of the states and to produce maps of the protein subunits and cofactors of PSII, including the electron transport chain. They found that PSII undergoes significant conformational changes electron acceptor side and at the Mn4CaO5 core of the OEC. The metal cluster significantly elongates, making room and allowing for binding of the incoming water molecules. Then voilà! Water splitting!
So I know what you may be thinking: Why all of that lead-up to a simple protein shape change conclusion? Well, it’s all about mechanism, figuring out the process of photosynthesis at its most basic level. If you think about it, photosynthesis is the biological reaction. It is fundamental to life on Earth as we know it. It converted the oxygen-poor atmosphere of early Earth to the oxygen-rich atmosphere we (and all other respiring organisms) depend on, and continues to supply us with life-giving oxygen. That oxygen comes from this water splitting reaction, and the OEC is one of those structures where you usually have to but "possible model of..." in front. This type of study gives incredible resolution of this structure as well as a new methodology to gain further knowledge. With a more technological viewpoint, work like this could eventually lead to the development of an artificial leaf and synthetic photosynthesis. And, let’s face it, that is really really cool.
 Kupitz, C., Basu, S., Grotjohann, I., Fromme, R., Zatsepin, N., Rendek, K., Hunter, M., Shoeman, R., White, T., Wang, D., James, D., Yang, J., Cobb, D., Reeder, B., Sierra, R., Liu, H., Barty, A., Aquila, A., Deponte, D., Kirian, R., Bari, S., Bergkamp, J., Beyerlein, K., Bogan, M., Caleman, C., Chao, T., Conrad, C., Davis, K., Fleckenstein, H., Galli, L., Hau-Riege, S., Kassemeyer, S., Laksmono, H., Liang, M., Lomb, L., Marchesini, S., Martin, A., Messerschmidt, M., Milathianaki, D., Nass, K., Ros, A., Roy-Chowdhury, S., Schmidt, K., Seibert, M., Steinbrener, J., Stellato, F., Yan, L., Yoon, C., Moore, T., Moore, A., Pushkar, Y., Williams, G., Boutet, S., Doak, R., Weierstall, U., Frank, M., Chapman, H., Spence, J., & Fromme, P. (2014). Serial time-resolved crystallography of photosystem II using a femtosecond X-ray laser Nature DOI: 10.1038/nature13453
Arizona State University Science and Tech press release: "ASU-led study yields first snapshots of water splitting in photosynthesis"
Science Daily article: “First snapshots of water splitting in photosynthesis”
For more on the plant physiology:
ASU's page "What is Photosynthesis?"
James Johnson @ FSU page on "The Manganese-calcium oxide cluster of Photosystem II"
Dr. Jakubowski at Saint Johns University "Chapter 8 - Oxidation/Phosphorylation"
(images via FSU Molecular Expressions, Jakubowski's website, and Arizona State University, respectively)
Let’s start by accessing your long-term memory, dragging out some of that basic biology information you buried after high school and grabbing on to that dusty file about photosynthesis. If you remember, plants have little green, bean-shaped energy factories in their cells called chloroplasts. These chloroplasts are filled thylakoids stacked up in grana. The thylakoid membranes contain networks of pigments, including chlorophyll, arranged in aggregates or complexes. Think of them kinda like light energy harvesters. Energy is captured for functional and structural units of protein complexes called Photosystem I (PSI) and Photosystem II (PSII). PSI is the light reaction and converts light energy to chemical energy. The pigments of the complexes each absorb light and then pass along that light energy to the central chlorophyll molecule to do photosynthesis. The energy obtained in this reaction is stored in ATP (adenosine triphosphate) and NADPH (nicotinamide adenine dinucleotide phosphate-oxidase) molecules. PSII, the dark reaction, takes place in the stroma within the chloroplast. This reaction uses the Calvin cycle to convert carbon dioxide and energy from ATP into glucose (sugar). To say that is photosynthesis put shortly and simply would be an understatement, but keep this basic reaction in mind:6 CO2 + 6 H2O à C6H12O6 + 6 O2
It is important to mention that in PSII, water is photochemically oxidized to dioxygen (O2) by the oxygen-evolving complex (OEC), a metalloenzyme cluster containing manganese and calcium. The OEC cycles through five photo-catalytic stages (S0-S4) in which four electrons are sequentially extracted from the OEC in four light-driven charge-separation events by a repeatedly photo-oxidized chlorophyll center (Kok cycle). This is the reaction that makes all that oxygen we breathe.
2 H2O à S0-S4 à O2 + 4 H+ + 4 e-
 |
| Photo by: Mary Zhu @ ASU |
The new paper by Kupitz et al. (and al. and al. and al.) published in Nature looks closer (very close!) at this PSII water-splitting reaction. They had some issues to overcome if they wanted to collect more information on this reaction, mostly involving the static nature of X-ray crystallography and the damage done to the OEC with this method. Traditional X-ray crystallography enables 1.9Å resolution (near atomic) but the OEC probably suffers X-ray damage. To overcome this, the researchers used serial femtosecond crystallography. This method uses single shot diffraction patterns are collected from a stream of nanocrystals, using 120 Hz femtosecond (one millionth of a nanosecond!!) pulses from an X-ray Free Electron Laser (XFEL). The second is the quality of the structural information. These pulses are so intense that the sample/specimen is destroyed, but the pulse duration is so short that the diffraction is observed before the destruction occurs. The method produces millions of “snapshots” in hours and can collect time-resolved data for dynamic processes like water oxidation in PSII.
The researchers developed a multiple-laser illumination scheme to observe this dynamic reaction in thermophilic cyanobacterium (Thermosynechococcus elongates). They progressively excited the OEC in dark-adapted PSII nano/microcrystals by two laser pulses from the dark S1 state via the S2 state to the double-flash putative S3 state (5 and 5.5Å resolution). Believe it or not, that was their method put simply. Essentially, they were able to determine the structures of the states and to produce maps of the protein subunits and cofactors of PSII, including the electron transport chain. They found that PSII undergoes significant conformational changes electron acceptor side and at the Mn4CaO5 core of the OEC. The metal cluster significantly elongates, making room and allowing for binding of the incoming water molecules. Then voilà! Water splitting!
So I know what you may be thinking: Why all of that lead-up to a simple protein shape change conclusion? Well, it’s all about mechanism, figuring out the process of photosynthesis at its most basic level. If you think about it, photosynthesis is the biological reaction. It is fundamental to life on Earth as we know it. It converted the oxygen-poor atmosphere of early Earth to the oxygen-rich atmosphere we (and all other respiring organisms) depend on, and continues to supply us with life-giving oxygen. That oxygen comes from this water splitting reaction, and the OEC is one of those structures where you usually have to but "possible model of..." in front. This type of study gives incredible resolution of this structure as well as a new methodology to gain further knowledge. With a more technological viewpoint, work like this could eventually lead to the development of an artificial leaf and synthetic photosynthesis. And, let’s face it, that is really really cool.
Arizona State University Science and Tech press release: "ASU-led study yields first snapshots of water splitting in photosynthesis"
Science Daily article: “First snapshots of water splitting in photosynthesis”
For more on the plant physiology:
ASU's page "What is Photosynthesis?"
James Johnson @ FSU page on "The Manganese-calcium oxide cluster of Photosystem II"
Dr. Jakubowski at Saint Johns University "Chapter 8 - Oxidation/Phosphorylation"
(images via FSU Molecular Expressions, Jakubowski's website, and Arizona State University, respectively)
Thursday, September 12, 2013
Dealing with Drought: How Do Plants Cope?

Have you noticed how often drought has been in the news lately? You don’t have to be a scientist to know that drought is bad. But, if you’re a plant, how bad is bad? I mean, you’re a plant; it isn't like you can pick up your roots and go looking for the nearest water source. You must have ways to cope, strategies that will let you survive until water arrives. A new paper in Tree Physiology caught my eye today that examines how plants handle drought in our changing climate.
We know that drought and elevated temperatures have all sorts of effects on ecosystems worldwide. The ecosystem level is a bit broad so let's narrow the scope a bit, just looking at plants. The average person tends to think about plants as just that: plants. They are green, they grow. Okay, but we really need to think of them as different species that have their own strengths, weaknesses, and strategies to cope with hard times. Different species of plants react to drought and elevated temperatures differently, some are better able to cope than others. It is known that drought and temperature influence seedling and sapling establishment and survivorship. To anthropomorphize a bit, some infant and toddler plants survive to grow up into adults and others...well...don't. The results of this survivorship will profoundly affect the composition of the community (collectively, which species are there) and how that community changes over time. Additionally, drought and elevated temperatures may affect our efforts to restore habitats. If newly planted saplings die within the first few years of planting then the restoration fails. If we get even more doom-and-gloom with it, extreme drought will cause massive forest dieback, releasing huge amounts of stored carbon and exacerbating the problem.
Let's narrow the scope a bit more. The survivorship of plants is related to their physiology and productivity. In general, growth is the most sensitive to drought. This is followed by photosynthesis and then respiration. The timing and extent of these declines is governed by changes and coping methods for water balance (water supply vs. water use), carbon balance, and strategies to balance the water loss and carbon gain. Most climate models predict that with increased atmospheric carbon dioxide (CO2) and warming the intensity and timing of droughts will go up. Now, carbon dioxide is good for plants because they use it like we use oxygen, to make energy. Give plants more CO2 and you see increased leaf area, productivity, photosynthesis, and carbon storage (in this case we are talking about non-structural carbohydrates (TNC)). Warming under well-watered conditions isn't too bad either, but under drought, warming will decrease photosynthesis and carbon storage while increasing water loss. But increasing CO2, warming, and drought are not solitary factors; you need to look at them in combination. Elevated CO2 will lessen drought stress, but warming worsens it. Based on what we know of the individual factors, the effects of elevated CO2 plus warming plus drought may vary depending on the trade-offs a plant makes. This new study in Tree Physiology looks at how drought alone and in combination with CO2 and warming affects carbon dynamics (growth, photosynthesis, respiration, TNC).
To do this they raised Blue Gum (Eucalyptus globulus) seedlings under ambient CO2 and temperature conditions. After one month they transplanted and separated them into their various treatment groups. These treatment groups were put in whole-tree growth chambers where the conditions could be very carefully controlled. There were four CO2 and temperature combinations: two CO2 levels (400 and 640 μl l−1) and two temperatures (28/17 and 32/21°C day/night, a.k.a.ambient and ambient + 3°C). Within each of these treatments, seedlings were designated to a drought regime: well-watered/control, sustained drought, rewatered drought (watering after sustained drought), and progressive drought (on rewatered and sustained treatments). They were able to maintain the "sustained drought" condition by adding just enough water to maintain leaf stomatal conduction (a measure of the rate of CO2 entering and water vapor exiting the stomata/pores of the leaf).
The researchers took gas exchange measurements, specifically looking at leaf net photosynthesis and leaf respiration rates. They also randomly selected individuals at various times during the experiment’s duration to be harvested for dry mass measurements (leaf, stems and roots). TNC concentration was calculated as the sum of starch and soluble sugar concentrations.
The results showed effects of progressive drought to be similar in rewatered and sustained drought plants. These plants were limited in growth, photosynthesis and respiration. However, there was not a decrease in TNC, although the drought plants did convert quite a bit of their starch into soluble sugar. This means that the plants consumed less TNC, and the soluble sugars likely serve some other function apart from a respiratory carbon source during drought (perhaps osmotic adjustment and/or hydraulic transport). They also found that elevated CO2 ameliorated the stress of their plants in the moderate drought treatments. These plants showed increased photosynthesis and TNC reserves. This suggests that the plants have the capacity to withstand drought, having sugar available for osmotic adjustment (think: better water movement, which is good for growth and photosynthesis). Conversely, elevated temperature exacerbated moderate drought stress by reducing photosynthesis, increasing leaf respiration and decreasing TNC reserves, and reducing the plants’ capacity to withstand drought. The combined effect of elevated CO2 and increased temperature is a little more complex. This study found only moderate benefits to plants, with similar/lower carbon uptake and greater carbon loss during the moderate drought treatment. TNC was found to be higher which suggests that there may be some carbon storage going on. However, these benefits went away when the plants were subjected to extreme drought. I suppose that is to be expected. They don’t call it extreme for nothin’ right?
Perhaps we can find a silver lining from this story. Plants are resilient organisms that have the capacity to withstand more than we had thought even when they are hit with multiple stressors. They can deal with moderate droughts, but extreme is still extreme and nothing survives everything. I didn’t say it would be a thick silver lining, but we can potentially use this knowledge to help us mitigate some of the effects of climate change and work to better restore lost habitats.
(image via TrendsUpdates)
Friday, April 12, 2013
Om Nom Nom: The Links Between Plant Diversity and Herbivory

I usually start a post with the reason why a particular article caught my eye. Today, I’m not sure why my eyeballs glommed on to this paper, but they did. As it turns out, they have a pretty good taste in articles. Who knew?
An early view paper from the Journal of Ecology looks at how the large herbivores of the African savanna affect the diversity and community structure of plants. More and more studies these days are taking a phylogenetic approach to community ecology questions. That is, they are looking at the evolutionary development and history of a species or taxonomic group to explain the patterns that we currently see. This new study takes this approach in the subtropical woodland biome, or “bushveld,” of the Kruger National Park (KNP) in northeast South Africa. This area is home to 148 mammal species, of which 30 are large herbivores such as elephants, rhinos, and giraffes. The vegetation of this area consists of 1974 species, including 458 species of trees and shrubs. KNP varies from dense thicket, savanna woodlands to forests characterized by tall trees and a closed canopy. These plant communities are under occasional pressure from periodic fire and under constant pressure from large herbivores. This study looks at the impacts of these herbivores on the phylogenetic structure of woody plant assemblages and evaluates the impacts of their removal on plant community composition and structure.
The researchers used DNA sequencing to reconstruct the phylogeny of 448 species of trees and shrubs (using Amborella as an outgroup), representing 246 genera, 71 families and 31 orders. ... Let’s pause for a second to say “Wow!” ... Then they calculated divergence times and used speciation models on these data. Next was the community sampling along a north-south transect through KNP. This transect has enclosures situated along it where large herbivores are partly or fully excluded. These enclosures have been established in the park for between 8 and 43 years. Within 15 defined “ecozones,” the researchers surveyed 110 50x50 meter unrestricted herbivory plots and 15 50x50 meter plots in each of the five herbivore exclusion enclosures. Within these plots they recorded all species of trees and shrubs and the number of individuals per species (abundance). Then they evaluated various physical and mechanical plant defense traits (not including chemical defenses), using wood density of quantify plant resistance to physical damage and specific leaf area (SLA) as a proxy for leaf nutrient content.
All sorts of indices (MPD, MNTD, SR, Shannon, NRI, NTI) and statistics were used that I’m not going to go into because they will just confuse everyone. But when all the statistics were done, they found a latitudinal gradient in diversity with the highest diversity in the south and extreme north and low diversity in the center (which matches rainfall patterns). In parallel, they found shifts in community phylogenetic structure comparable to these changes in community diversity, indicating that the communities in the center are more highly phylogenetically clustered (composed of more closely related species). Plant diversity in the KNP is strongly spatially structured and this clustering is reflective of generalist browsing, the geomorphology of the area, and the patchy distribution of large herbivores. In plots where herbivory is unrestricted they found significant phylogenetic clustering of plant communities, likely the result of the heavy pressure from the herbivores. They also found that plant defense traits had a weak but significant phylogenetic signal, suggesting that they do not fit well into the simple model they used. When the researchers compared the enclosures to the unrestricted areas they found “that when megaherbivores are excluded, species diversity generally decreases, but changes in phylogenetic diversity [vary] by spatial location.” When large herbivores are excluded, plant community structure is contingent upon the initial community structure. If a community was initially overdispersed then the shift towards a more clustered community would occur by excluding large herbivores and vice versa. Ultimately, they conclude that the exclusion of large herbivores results in impoverished species communities.
I think that it is important to mention that these researchers were limited by the study design they had to work with. These enclosures had already been set up by other people. As such, the scientists encountered some issues that they would have been able to control for if they had set up the site themselves. Issues like enclosure age and location. For example, one enclosure was located on a river that periodically floods, altering local plant diversity. Such issues make it difficult for them to predict how specialist vs. generalist herbivores impact community structure and prevents them from drawing strong conclusions about the underlying causes for the patterns they saw.
On the upside, their results add valuable knowledge critical for predicting the impacts of overall herbivore decline on African ecosystems and local increases of these animals in protected reserves. This study “shows not only that large herbivores are key to maintaining woody plant diversity, but also that they may impose specific phylogenetic structure on plant communities.” Shifts in this structure have downstream consequences in that phylogenetic diversity can capture genetic and functional diversity, which has been linked to ecosystem productivity. And, ultimately, we want to keep our ecosystems happy and productive, right?
(image via Animals Time)
Friday, March 29, 2013
Getting to the Roots (and Fungi) of Carbon Sequestration

This week, I found a paper that I’m calling the best of both worlds. Well, for me at least. This paper combines my past (and lingering) interest in island biogeography with a current interest in climate change and carbon storage.
If you have been reading my blog long enough then you already know my love of islands. They are just so darn useful. In the past, I have focused on oceanic islands, but lake islands are also really neat. These types of islands typically form when lower lying land areas fill with water, effectively cutting off higher areas from the mainland and making them into islands. As such, these islands usually already contain forest as opposed to an oceanic island that emerges from the ocean and must be colonized. A new study, published in journal Science, looks at a fire-driven boreal forest chronosequence on forested lake islands in northern Sweden. Such a chronosequence allows the study of soil carbon sequestration over time scales of centuries to millennia.
This new study looks at roots and their associated fungi (mycorrhizae) as sources of this stored carbon. I’m not going to spend the space to describe mycorrhize, but will, instead, send you over to my Free Market Fungi post for more information, if you need it. It is known that 16 percent of the global carbon stock is sequestered in soils. To date, most carbon studies of this type focus on aboveground leaf litter as the fundamental determinants of this carbon accumulation. But a large portion of photosynthetically fixed carbon is actually directed belowground to the roots and, subsequently, the mycorrhizae. Now, let’s add fire. It has been shown that when a forest doesn't burn, the soil and ecosystem carbon accumulate unabated, and in a linear fashion. Add this information together and it becomes a big deal when it comes to correctly allocating carbon, calculating the long term sequestration rates, and predicting how forests will respond to climate change and other environmental shifts.
The study sites were in two adjacent lakes, Lake Hornavan and Lake Uddjaure, in northern Sweden. The islands in these lakes were formed after the most recent glaciation and come in a variety of sizes. In terms of fire, larger islands burn more frequently because they are larger targets for lightning strikes. As a result, several of the large islands in these lakes have burned in the last century, whereas some of the small islands haven’t burned in at least 5000 years. This lack of fire leads to very thick humus layers (or organic layers towards the top of the soil column) on smaller islands, up to 1 meter thick!
The researchers divided islands into three size classes of 10 islands each: large (over 1 ha), medium (0.1-1.0 ha), and small (less than 0.1 ha). They took soil samples from these islands to look at the organic soil profiles and found that large islands accumulated 6.2 kg of C per square meter belowground with a mean time since fire of 585 years, medium islands accumulated 11.2 kg of C per square meter with a mean time since fire of 2180 years, and small islands 22.5 kg of C per square meter with a mean time since fire of 3250 years. Then they looked at the carbon dynamics across this chronosequence by analyzing bomb 14C. This allowed them to determine the age since fixation of soil carbon. Then they fitted a mathematical model to measurements of carbon mass and age distribution across the soil profiles for six of the islands (3 large, 3 small). This model revealed that the distribution of carbon mass and age could only be predicted when they included carbon from roots. This root-derived carbon accumulation was found to be larger on small islands (70 percent, that's a LOT!) than large islands (47 percent). They were able to explain the entire carbon sequestration difference on small islands from these root-derived inputs. The model also showed that small islands store a major proportion of their soil carbon in the deeper soil layers, those over 100 years old. However, below 20 cm depth, the root-derived carbon inputs were shown to be low and to decompose slowly. So the root-derived carbon input into the upper layers probably contributes to the long-term buildup of humus that is seen on these islands. But, as usual, that's not the end of the story.
We know that fungi play very important roles in forest ecosystems, both as decomposers and in root-assoicated carbon transport and respiration. So the researchers also profiled the relative abundance of major groups of fungi by depth in the soil profiles. They found that the upper soil layers are dominated by free-living saprotrophs (fungi that obtain their nutrition heterotrophically from non-living organic materials), and greater depths were dominated by mycorrhizal and other root-associated fungi. Their model suggests that these mycorrhizae live at the spots where the largest difference in carbon sequestration between the island size classes exists, which also tends to be the areas of highest root mass. When they ran tests for fungal biomass throughout each soil profile they found greater mycelial (the vegetative part of a fungus, consisting of a mass of branching, threadlike hyphae) production on large islands, but less mycelial necromass (dead stuff) on small islands. This suggests that the large production is counterbalanced by faster decomposition of mycelial remains. “Correspondingly, the 14C model indicated faster decomposition of root-derived [carbon] on large islands, despite inputs being conservatively constrained to be equal across all islands.”
I found these conclusions to be interesting because of the amount of soil carbon from roots and mycorrhizal fungi, especially on small islands. And although they saw less carbon accumulation on large islands, these islands have a greater root density and so should have more carbon allocation to roots and the associated fungi. Did you catch the contradiction? Well, in response to increased carbon dioxide, there will be an increase of carbon inputs to the roots which will accelerate the turnover of soil organic matter. This counteracts carbon accumulation and enhances nitrogen cycling through the microbial pools, an effect these researchers observed when they tested the C:N-ratios in the humus of large islands. This is much lower on small islands, possibly because of impared mycorrhizal nitrogen mobilization and the accumulation of nitrogen in fungal remains. This leads to progressive nutrient limitations, then leads to changes plant productivity, leading to changes in community composition, which leads to changes in total belowground carbon allocation, that leads to changes in fungi.
Definately starting to grasp the importance of the belowground dirty stuff. There’s a whole lot of carbon down there that we need to start looking at, accounting for, and seeing where it goes. We know that changes in the environment such as climate change, soil fertilization, fire suppression, and forest management make big differences to the aboveground stuff. It only makes sense that the belowground stuff is impacted as well.
If you would like some follow-up reading I suggest:
Treseder, K. K. (2013-03-29) Fungal Carbon Sequestration. Science, 339(6127), 1528-1529. (DOI: 10.1126/science.1236338)
Also check out the write-up in Nature "Fungi and roots store a surprisingly large share of the world's carbon"
(image via Forest Keepers)
Thursday, March 21, 2013
The Rose Shank

(via Alex Culang and Raynato Castro's website Buttersafe)
note panels moved vertically for space requirements
Monday, March 18, 2013
Biological Beta Testing: Altitudinal Edition

Spatial patterns in biodiversity have always been a popular topic in ecology, and understanding these patterns helps us to address the looming threats to biodiversity.
Did you notice how I made the word ‘patterns’ plural? There isn’t a whole separate field of biogeography for nothin’. Biological diversity is difficult (some say impossible) to measure using a single metric. How do you count things? Simply by the number of species? How about rare versus common species? What about species turnover? What geographic scale are you using? How and/or do you define boundaries? Would you like me to keep going or do you get the point?
Lately I’ve noticed a surge in the number of studies that look at diversity gradients that occur along latitude and altitude. We visited the topic of latitude and diversity back in October of last year with the “Dinosaurs, Diversity, Distribution, and the LBG” post. Essentially, latitudinal gradients (LBG or LDG) occur when species richness (a simple count of species) is highest in the tropics and declines polewards (warm areas are more hospitable and produce more food). Altitudinal, or elevational, gradients are nearly as ubiquitous as latitudinal gradients, and they have many of the same characteristics. As you go up in elevation (as on a mountain) the temperature gets colder and habitat areas and the communities they support become smaller and more fragmented. Gradients such as these are overall patterns. Now mix them with diversity indices. In 1960, R.H. Whittaker described the terms alpha diversity (α-diversity), beta diversity (β-diversity), and gamma diversity (γ-diversity). Basically, the total species diversity of a geographic area (γ-diversity) is determined by the mean species diversity at the local, within-site or within-habitat scale (α-diversity) and extent of change in community composition between sites (β-diversity). These definitions have been much argued over (see Tuomisto 2010), and we won’t get in to that. We are going to focus on beta diversity (β-diversity), also called species turnover or differentiation diversity. It is a measure of how different sites are from each other and/or how far apart they are on a gradient of species composition. Factors that drive β-diversity are very important, very poorly understood, and very much argued over. Is it dispersal limitation? Habitat specialization? Environmental heterogeneity? The studies published so far seem to lean toward multiple processes operating at various scales. *sigh* Isn’t that always the way? Observational and experimental studies have shown that impacts on β-diversity vary with productivity. So it would make sense to test this in relation to altitudinal and elevational gradients.
A new study to be published in Global Ecology and Biogeography looks at how local community processes may create an altitudinal pattern of β-diversity. Their study site was the Shiretoko National Park in north-eastern Hokkaido, the northernmost island of Japan. In addition to being one of the richest temperate ecosystems in the world, the area is characterized by sharp altitudinal changes in forest structure and productivity as a result of strong winds on the western side of the mountains. The researchers chose this western side to measure the diversity of woody plants and mites (Oribatida) in mature stands where they set up seven plots (each containing 10 subplots) at different altitudes. For the woody plants they recorded the number of individuals taller than 0.5 m, measured the girth at breast height (GBH), estimated the total basal area (BA), recorded canopy height (CH) of the stand, measured the diameter and length of all coarse woody debris (CWD), measured understory light, took soil cores to extract the mites, removed roots from the soil samples, measured the thickness and dry mass of the soil surface litter (A0 layer), collected leaf litter, measured water content and pH of the litter, and the carbon-to-nitrogen (CN) ratios of the litter and soil. They then calculated the β-diversity of the two organism groups for each altitude. So as to take into account the dependence of β-diversity on gamma diversity (γ-diversity), they used null modeling. This type of modeling “randomly shuffles individuals among subplots while preserving γ-diversity, the relative abundance of each species per plot and the number of individuals per subplot” which enabled them to estimate how much observed β-diversity differed from expected β-diversity. They also calculated a β-deviation value for each altitude. This is equivalent to a standardized effect size, indicating the magnitude of the deviation from what you would expect of a random (stochastic or by chance) assembly process.
First we’ll hit the results for the oribatid mites. These results showed the altitudinal gradient of β-diversity to be less evident than it was for the plants, and β-deviation showed no altitudinal gradient. That said, they found β-deviation to always be greater than expected in all locations for both woody plants and oribatid mites. In woody plants, the magnitude of β-deviation increased with altitude, suggesting that deterministic processes dominate in low-productivity, high-altitude stands, the role of these processes increasing with decreasing productivity in plant communities. The authors conclude that their results support the hypothesis that “the mechanisms underlying community assembly (e.g. niche versus neutral) play an essential role in creating biogeographic patterns of β-diversity.” They found that niche-based processes (species correlate with environmental variables, the conditions in which the species can persist) govern high-altitude stands, particularly when they included the plants growing in lower layers in the analysis. They found similar results when they calculated β-deviation along a stand-structure gradient with basal area, not altitude, particularly when small understory plants were included. This suggests that “given the altitudinal changes in stand structure, the role of understory plants in deterministic assembly becomes more dominant with altitude.” So those little guys really make a difference! Why? Well, considering that light is a precious commodity, low-elevation, structurally well-developed stands have higher competition for available light, especially for those little understory guys. This fierce competition isn’t so fierce in the higher altitude sites where the upper canopy isn't there to usurp all of the light for itself. This favors a greater, more diverse understory in higher elevations. Again, the authors speculate that this greater high altitude diversity is due to fine-scale niche partitioning, which allows more individuals to exist together.
Okay, so that is a pretty good explanation for the high altitude communities. Now what is going on at low altitudes? Well, there you have to take the site’s history a little more into account. What made these stands so “structurally developed” and generated this stochasticity? Consider this: The canopy trees of these forests colonized before the understory individuals, negatively affecting understory species by reducing the availability of space and resources. You then see a relative dominance of these big-ole-bully trees (that’s a technical term, you know) and a one-sided competition scenario.
Did I scramble your brain and make you hate biogeography yet? Can you see any sort of overall conclusion here? Lemme help you out…
β-diversity is dependent on community processes and shaped by local factors within the landscape. The species in a place use what is in a place.
Do you agree?
(image via Japan-Guide.com)
Friday, January 4, 2013
Burn Baby Burn: Fire, Forests, and Carbon

I know, I know. I've been a bit absent over the last few weeks. I'm going to call laying on the beach in South Florida at Christmas enough of an excuse. That and I was finishing up my Wildland Firefighter course. Yep, I'm now all certified to start and stop forest fires. Should you be afraid? Perhaps. But it got me to thinking about prescribed burning, an area of ecology that I know about but don't regularly keep up with the literature. So I decided to take a look at what has recently been published on the topic and found a nice paper in the journal Forest Ecology and Management about the balance of carbon sequestration and habitat conservation as they relate to fire.
Most people tend to think Fire = Bad. In many situations that's true, but in others fire is actually a natural, healthy process. In the past, various federal and state agencies have instituted wildfire suppression policies because they thought it was the best way to preserve the natural state of the land. All it really did was create a massive amount of fuel loading - lots and lots of fuel (dead logs, leaf litter, etc.) around to burn - which created even larger, more destructive fires. Now we know better, and the idea of a more natural fire regime is being used to control fuels and keep the balance of natural habitats.
Today's paper takes a look at woodlands, a subset of forests that are composed of low density, short trees that typically have an open canopy with a ground layer made up of shrubs, grasses, and forbs. They can be economically important for lumber and livestock grazing, but they are also naturally important as significant carbon (C) sinks and as a biologically diverse habitat. Fire is known to be an important process in this ecosystem and is managed such that willdfires are allowed to burn unhindered, landscape level fuel management helps contain fire spread, and prescribed burning reduces fuels. This study investigates the effects of past fires on carbon storage, woody vegetation community composition, and habitat suitability. They do this by utilizing a "chronosequence" approach. This means that they grouped and compared stands of trees at different successional stages following fire events. These stands were located in the woodlands of Balcones Canyonlands National Wildlife Refuge (BCNWR), located northwest of Austin, Texas, USA. The dominant woody vegetation in this area is the evergreen Ashe's juniper (Juniperus ashei), with subdominant species including several oak (Quercus spp.) species and Escarpment Black Cherry (Prunus serotina var. eximia). These woodlands are also inhabited by the golden-cheeked warbler (Dendroica chrysoparia), an endangered bird species they used to assess habitat suitability. The mixed juniper-oak are critical for this warbler as they use the stringy, sloughed bark from the mature Ashe's juniper exclusively for nesting material and requre Lepidopteran (Geometridae) larvae that feed on broadleafed foliage during the spring breeding season.
The researchers established 60 plots next to trees that had been used for a previous dendrochronology (tree rings) study. That means that they had the history of the tree from the tree rings, this history including fire scars that could be pinned to exact years. The fires were low-intensity, surface burns that mostly consumed the ground layer, seedlings, and saplings. From this they were able to pick sites with single fire events and then assign their plots into three groups: recent-fire (less than 40 years), old fire (greater than 40 years), and no fire. Then, for each plot, they identified tree species and measured their diameter and heights, collected data on woody debris and leaf litter depths, and collected soil samples for carbon and nitrogen analysis.
The authors found significantly different total aboveground biomass C averages for the 60 study plots. Recent-fire showed 5.25 kg m-2, old fire averaged 6.86 kg m-2, and no fire had 9.18 kg m-2 of C. Previous studies have shown that low to moderate intensity fires have less effects on live biomass, stabilize carbon fast afterwards, and primarily affect trees in an age-specific and density-related way. This study found that "the impact of low-intensity fire on C storage increases for sites with higher proportions of biomass in small trees" (greater than 20cm in diameter) as these are more greatly impacted by surface fires.
This study's results support that periodic surface fires maintain many forests by favoring fire-tolerant species, such as oaks, and decreasing the density of fire sensitive species, such as juniper. They found that sites with a single fire disturbance had a higher density of oak seedlings than juniper seedlings (though not significantly so), especially in years that had low precipitation in the summer. The densities of mature trees was found to be mainly influenced by differences in topography, herbivory, and historical climate.
I would like to say that all of this added up to a good conclusion about habitat suitability for the golden-cheeked warblers but, unfortunately, they found significant differences. Fire reduces mature tree density, which has a negative impact on habitat suitability, but high intensity fire is related to higher oak recruitment (food source for their food source). Managing these woodland for the golden-cheeked warbler may require both mechanical treatment and the use of fire. The critical core breeding habitat for this warbler includes old-growth stands composed of large, mature junipers and about a 40 percent oak species mix. These stands should be protected from intense fire through the mechanical thinning of the understory and the removal of heavy fuels.
Overall, the authors conclude that fire management can achieve multiple outcomes on a single site. This means that detailed ecological information about the species composition and population structure of an area are needed in order to assess conditions and projections on restoration.
More on wildland fires and prescribed burning:
GeoSTAC's Wildland Fires page
University of Florida IFAS Extention's "Benefits of Prescribed Burning"
National Interagency Prescribed Fire Training Center
(image from Texas Department of Agriculture)
Monday, December 17, 2012

Thursday, December 13, 2012
Drinking the Clouds

I don’t often talk about water movement in plants even though I work in a lab that studies water movement in plants. I should probably ruminate on that but won’t. Instead, I’ll start out by putting a complex problem into the simplest of terms: Plants drink water with their roots. Okay, that’s true but perhaps it is a bit too elementary. I think that, in this case, I need to explain it in more detail so that you can really appreciate why a certain research paper caught my attention.
For water to do all the important things it should, it needs to get in and around the plant. This is one of the most basic plant physiology…no, basic biology mechanisms we know. Water diffuses in near the tip of a growing root (you know, the hairy part) and makes its way to the xylem. The xylem is the vascular tissue that conducts water and dissolved nutrients to all parts of the plant. Considering that plants grow up, this water must be moved against gravity. This is where transpiration, root pressure, and capillary action come in. Transpiration (like evaporation, it is the loss of water vapor from parts of a plant, usually the leaves) causes tension and pressure that pulls water up, and root pressure pushes water up when transpiration is low, the soil is moist, and when the roots are absorbing lots of water. Capillary action helps it all as it allows water to flow up the narrow channels of the xylem. The leaves are where the plant usually loses water. Leaves have many, small structures called stomata that function in gas exchange. Guard cells open and close a stoma, and when the carbon dioxide is let in water vapor can be let out. Plants can lose a lot of water through transpiration and have various methods (that I won’t go in to) to try and combat it. Now, this sounds like a lot of info but I’m really just barely scratching the surface (see some links below if you want to know more) of this process. What makes the paper I read today so interesting is that it adds another layer to what we already know about water movement in plants.
The authors of a new paper, published online in Ecology Letters, take a look how plants function in cloud forests. These forests are unique and super neat! Tropical montane cloud forests (TMCF) are among Earth’s most rare and endangered ecosystems occupying just 1.4 percent of the world’s tropical forest area. They are like rain forests in that they receive high levels of precipitation. Where they differ is that much of this precipitation comes directly from clouds, through the cloud filtering of the trees. Lateral cloud filtering is a process where clouds blow among the trees and the moisture condenses as it touches the leaves, forming water droplets. This process reduces the vapor pressure deficit (VPD) and photsynthetically active radiation (PAR), decreasing plant water demand and suppressing leaf-level transpiration. When regular, vertical precipitation is limited in the dry season these cloud water droplets can become an important water source. The researchers in this study looked a phenomenon referred to as foliar water uptake (foliar uptake), where this condensed water is taken in through the leaves, and its occurrence in TMCFs.
The researchers compared neighboring tropical montane and pre-montane cloud forests along the Pacific slope of the Cordillera de Tilarán mountains near Monteverde, Costa Rica. They characterized the cloud cover using remote sensing and created an environmental characterization of the forest by looking at factors such as humidity, temperature, soil water content, rainfall, and leaf wetness. Then they characterized and compared foliar uptake in situ in both forest types, measuring sap flow on the small branches of woody plants using the heat ratio method. They also measured the capacity for foliar uptake in several woody plant species by collecting leaves, rehydrating them, and measuring them individually in the lab.
The researchers found that during the dry season, the pre-montane cloud forests (which are further west and at a lower elevation) are subject to greater rain shadow and less cloud immersion. These forests experienced, on average, a lower number of hours of leaf wetness per day and a shorter duration of each individual leaf wetness event when compared with the tropical montane cloud forests. The higher cloud cover frequency of the TMCF resulted in more, longer leaf wetting events resulting in foliar uptake. They found the prevalence of foliar uptake to be quite high and widespread among species, occurring independently of phylogeny, morphology or growth habit. This foliar uptake also took a significant role in the plants’ water status both in the field and in the lab, resulting in greater water deficit reductions. Furthermore, the results showed that the TMCF plant community demonstrated a higher capacity for foliar uptake than did the pre-montane plant community. This is interesting because foliar uptake benefits the drier, pre-montane forest more and yet these forests are unable to capitalize on them physiologically to the same extent as the TMCF plant communities. This may be a result of the presence or frequency certain leaf traits that facilitate the uptake (cuticle, trichomes, hydathodes) or the ability of water to enter the stomata.
As with everything we do now, look at this through your climate change lenses. What are the consequences of climate change in these ecosystems? Tropical mountains are projected to experience high rates of climate change, increasing dry season surface air temperatures 3.8°C and decreasing precipitation by 14 percent. All of this could increase cloud frequency and cloud base height causing a higher water demand in these plants.
All in all, this new layer to the water movement mechanisms we all know and love is pretty thought-provoking. I know it set out to shed light on the prevalence and role of foliar uptake, but, with me, it had a greater impact in thinking about its consequences. The effect of drought on plants is a hot topic in the plant physiology world, and this paper is an interesting way to look at it.
More on water movement in plants:
Bellevue College's "Transport in Plants" notes
Univ of Illinois at Chicago's "Transport in Plants" lecture notes
Science Mag's "Transpiration: Water Movement in Plants" (Flash player animations that are good)
About cloud forests:
Community Cloud Forest Conservation
Canopy in the Clouds
On this story:
Science Daily: "Cloud Forest Trees Drink Water Through Their Leaves"
UC Berkeley's "Cloud forest trees drink water through their leaves"
(image via Buncee.com)
Friday, May 4, 2012
Biodiversity Good, Extinction Bad, Climate Change Worse
 |
| This phylogenetic tree of life was created by David Hillis, Derreck Zwickil and Robin Gutell. It depicts the evolutionary relationships of about 3,000 species throughout the Tree of Life. Less than 1 percent of all the known species. Download the pdf from the Hillis Lab. |
It has been established that the current rate of species extinction has far outpaced those rates we see in the fossil record. By "far outpaced," we're talking about a sixth mass extinction within 240 years (that's the projection as of now at least). There have been hundreds of experiments that have tackled this question of biodiversity and ecosystem processes, particularly in plant systems. Take a big statistical spoon and mix all the experiments together and you find that the loss of plant biodiversity affects biomass production and decomposition. Experiments to manipulate biodiversity in controlled environments have actually found that biodiversity can act as an independent variable that directly controls such ecosystem functions as nutrient cycling and biomass production. Studies have shown that greater biodiversity also increases these effects over time, likely by either a saturating response curve (large increases in ecosystem functioning as species are added to communities, leveling off after a while, with any additional species only increasing ecosystem functioning by small amounts) or a linear response curve (think: straight[er] line). These temporal aspects of diversity-productivity relationships are still somewhat obscure, particularly the mechanisms of these changes over time. Now add global climate change. It is uncertain the sizes these effects will be and how the direct effects of other types of environmental change (like atmospheric composition, nutrient pollution, etc.) will affect ecosystem functioning.
So far the month of May has yielded some big, interesting papers on the impacts of biodiversity loss. A paper by Peter Reich et al. in Science takes a look at the time component of biodiversity loss and how it affects the growth curves I mentioned above. In this paper, the authors present data from two long-running (≥13 years) grassland biodiversity experiments at the National Science Foundation's (NSF) Cedar Creek Long-Term Ecological Research (LTER) site in Minnesota, USA: the “Cedar Creek Biodiversity Experiment” (BioDIV), planted in 1994–1995, and the “Biodiversity, CO2, and N Experiment” (BioCON), planted in 1997. At these sites a number of plots are planted with different numbers of species of plants including various C3 and C4 plants and nitrogen (N)-fixing and non-fixing dicotyledonous herbs. The authors looked at the effects of diversity on biomass productivity and found that productivity (aboveground and belowground) increased and became less saturating over time; the diversity-productivity relationship became more linear and less strongly decelerating over time. Their evidence suggests that this may be due to the accumulating effects of complementary resource acquisitions and use and such ecosystem feedback effects as soil N cycling. Basically, the plants are complementing each other, increasing the functional diversity of the system. The greater the diversity of plants the more natural components (carbon, water, etc.) of the system can be capitalized on over time, a result that short-term experiments may underestimate.
 |
| The Cedar Creek LTER site (Credit: David Tilman, UMN) |
 |
| Figure from Cardinale (2012) |
I hope I've made my point that biodiversity = good, extinction = bad, and climate change = worse. I also hope I (and these authors) made the case that the loss of biodiversity isn't just a consequence but rather a major driver in key processes that affect our planet. Think about it.
You can read more in the articles:
And here are some additional write-ups:
NSF story "Ecosystem Effects of Biodiversity Loss Rival Climate Change and Pollution"
NSF story "Plant Diversity Is Key to Maintaining Productive Vegetation" also at Science Daily
And some related websites you may want to visit:
Cedar Creak LTER site
LTER Network
Subscribe to:
Posts (Atom)