
Showing posts with label molecular. Show all posts
Showing posts with label molecular. Show all posts
Friday, May 19, 2017


Thursday, May 11, 2017
Tuesday, February 28, 2017
Friday, May 1, 2015
Maturation is Coming
BioLegend has come up with a great little page about cells will mature and change into different stages as they develop. The animations are pretty neat, showing what gets upregulated on T cells, Tregs, B cells (mouse and human), monocyte/macrophages (and subclasses), and dendritic cells. And a neat little gimmick is the Game of Thrones-esque House sigils they have created for each cell type:


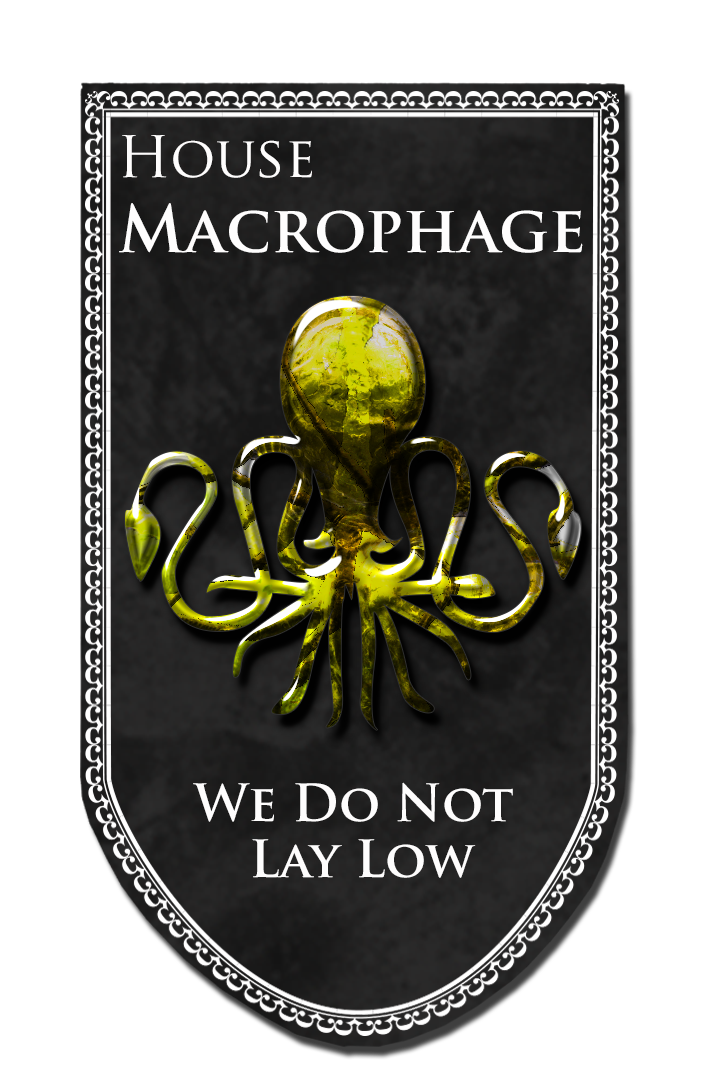

(via BioLegend Maturation Markers)
(via BioLegend Maturation Markers)
Thursday, September 4, 2014
The Simple Western
Another addition to the creative and fun science ad category.
a.k.a. Buy our really expensive stuff.
a.k.a. Buy our really expensive stuff.
Friday, July 4, 2014
The Bigfoot Question: A Genetic Analysis of Yeti Hair

It’s been a while since I’ve written about Bigfoot, and that’s a shame because he’s pretty fun to write about. As with many things, I like to keep it in a scientific context. That’s why I was pretty stoked to see a recent Sasquatch paper in Proceedings of the Royal Society B. A paper that takes an interesting approach: genetics.
Right off the bat the paper does not assume non-existence, both pointing out that there are numerous reports and sightings yet no bodies or recent fossils. Theories abound about what these animals are, ranging from surviving populations of collateral hominids to unlikely hybrids. As a general rule, modern science shies away from the yeti-finding field, to the point that they make believers feel rejected. Admittedly, believers have point in that science should not accept or reject anything without examining the evidence and testing hypotheses. Pretty much the definition of science, right? So that's what authors Sykes et al. do, take a scientific approach.
 The researchers collected a total of 57 Bigfoot hair samples submissions from museum and individual collections. They went about it all officially with a joint press release in May 2012 by Museum of Zoology, Lausanne and the University of Oxford. Then, to eliminate obvious non-hairs, they subjected the samples to macroscopic, microscopic and infrared fluorescence examination. Based on provenance or historic interest, thirty-seven of the samples were selected for genetic analysis. Hairs were first cleaned to remove surface contamination - just consider how many people had handled a sample, so you need to eliminate known human DNA to leave just sample DNA. The meticulously cleaned hair samples were then ground in a buffer to homogenate, incubated with proteinase K, and extracted for PCR amplification. This amplification was of the ribosomal mitrochondrial DNA 12S fragment corresponding to bps 1093-1196 of the human mitrochondrial genome, using a permissive primer combination that allows for a wide range of mammalian DNA. The results were then compared to GenBank accessions for species identification.
 Perhaps it is important to point out what the 12S mitochondrial DNA is and how it works. Even within fur-bearing species, there is a large amount of variation in hair appearance that can be identified under the microscope to determine species. But, in the absence of an experienced hair examiner (yes, those exist), a reliable, alternative analysis must be used. This analysis comes in the form of highly conserved mitochondrial DNA regions, these are particular sequences that have been maintained by evolution despite speciation, probably because they are functional. Mitochondrial 12S ribosomal RNA has an amplification size that renders it useful for even problematic and/or degraded samples. Highly conserved primer regions and the high nucleotide species diversity present within the portion of the 12S gene examined allows for identification at least to genus and often species. Studies examining the extent of 12S homology within and between species have shown a high degree of confidence in the test's ability to match species from biological samples, usually hair. This includes primate homologies like the chimpanzee, who shares a 98% homology with the human 12S region, Gorilla (97%) and rhesus macaque (90%). These studies have shown that it is unlikely that a non-human primate hair could be confused with human hair using this system.
Now knowing all of this, back to the results of the Bigfoot study. Despite multiple attempts, seven of the samples yielded no DNA sequences, leaving the researchers with 30 samples. These 30 samples were each matched to a known species. Ten belonged to various bear species, four were cows, four were horse, four were wolves/dogs, two were raccoons, one was a deer, one a Malaysian tapir, one a sheep, one a serow, and one was human (exact match).
There has been quite a few articles in the news about this study, and that’s good because this paper is a nice example of using hard science to test a theory. It is also works towards bridging the gap between two rather disparate groups of people. So kudos to you Sykes et al.
 Sykes, B., Mullis, R., Hagenmuller, C., Melton, T., & Sartori, M. (2014). Genetic analysis of hair samples attributed to yeti, bigfoot and other anomalous primates Proceedings of the Royal Society B: Biological Sciences, 281 (1789), 20140161-20140161 DOI: 10.1098/rspb.2014.0161
A nice write-up from Science News "'Bigfoot' samples analyzed in lab"
For more on 12S see an article in Forensic Magazine titled "Easy Species DNA Identification for the Forensic Laboratory Using 12S Mitochondrial DNA"
(images via WhoFortedBlog, NewEngland BioLabs, Nature Reviews Genetic paper DOI:10.1038/nrg1606, respectively)
Thursday, April 3, 2014
Black of Hair: The Genetics of Westeros
It's back! SundaySundaySunday!
*Fangirl scream!*
Are you a Game of Thrones fan? I certainly hope so. We'll have so much more to talk about that way. I've been squirreling this topic away for a while now, but with the return of the show I thought I'd air it out. If you are a fan of the books and the show then you'll know that amongst the plethora of characters in Westeros there are some rather dubious things going on. This is where I yell SPOILER ALERT in the hopes that I won't ruin the surprises for the unsuspecting. You've been warned.
Westeros doesn't exactly have genetic profiling, but there are some features that don't really need it so much (ahem...all those blond Lannisters). Although, considering the protection and money you get from being a Lannister, the importance of being related to the Targaryens, and if you are a child of Robert Baratheon, it is probably good to know your genetic make up a bit better.
Way back in Season 1, Eddard "Ned" Stark started investigating the death of Lord Jon Arryn. This led him to The Lineages and Histories of the Great Houses of the Seven Kingdoms, an old book detailing the sigils, lineages, and appearances of the members of each noble House. This ultimately lethal path culminates in three simple words: "Black of hair..." Words that not only spelled out death for Ned but also led to the demise of most of his relatives. Ned was actually very clever, taking those words and employing the same logic behind those lovely Punnet Squares we all had to learn in biology class, drawing conclusions about Baratheon and Lannister genetics. A genotype from phenotype approach, if you will.

In the above comic, we are assuming that Robert was homozygous dominant (BB) for black hair. Had there been a relative that passed on a recessive blond hair allele (b) to him then he would be heterozygous (Bb) for the hair color trait. As a heterozygote, Robert would have black hair, but each of his children from a homozygous recessive (bb) mother would have a 2 in 4 chance of being blond. It is important to point out that this fifty percent chance is applied to each child independently, not that half of his children would be blond.
When it comes to an evidence-based conclusion, Ned didn't exactly have a large sample size. Considering Robert's philandering ways, the number of children produced was most certainly very large. But, Ned only looked at Cersei's children (Joffrey, Tommen, and Myrcella...all blond), the story of Cersei's first child (deceased...black hair), Gendry (black haired bastard of Robert by a tavern wench - her hair color unknown), and (sorta) Barra (bastard child by Mhaegan - a blond - of Petyr Baelish's employ). If Robert was homozygous dominant (BB) and the mother of each of his children was homozygous recessive (bb) then 100 percent of his children would be heterozygous (Bb) and black haired.
That said, Ned did have a good source in the Lineages and Histories book that describes all members of House Baratheon as "black of hair," except for the "golden headed" Joffrey (some minor TV vs. book differences here, but that lead to the same conclusions on my and Ned's part). By all members, I'm assuming this counts siblings, aunts, uncles, cousins, etc. Had there been a blond in there somewhere it would have given more credence to the heterozygous argument.
For the sake of length, and the fact that I really just wanted to post that funny little comic, I kept things simple. Genetics is oh-so-much-more complicated. If you want to read more about the genetics of Westeros then I'll draw your attention to two very well written articles over at Mad Art Lab:
The first nicely lays out the argument that "after enough generations of marrying into families like Lannister and Targaryen, we would expect some of the Baratheon kids to have blond hair, but they don't. That doesn't sound like Mendelian inheritance. What it does sound like is another phenomenon, called paramutation."
check out Genetics in Game of Thrones: "The Seed is Strong"
The next brings up many of the same points that I do. However, it spends more time asking what if you could look at the genes of the families? Essentially, what if we could give Robert, Cersei, Jamie, their children, etc. paternity tests? And how do you interpret the results?
check out Genetics in Game of Thrones: Forensics
And finally, for all you need to know about Game of Thrones check out the Game of Thrones Wiki
*Fangirl scream!*
Are you a Game of Thrones fan? I certainly hope so. We'll have so much more to talk about that way. I've been squirreling this topic away for a while now, but with the return of the show I thought I'd air it out. If you are a fan of the books and the show then you'll know that amongst the plethora of characters in Westeros there are some rather dubious things going on. This is where I yell SPOILER ALERT in the hopes that I won't ruin the surprises for the unsuspecting. You've been warned.
Westeros doesn't exactly have genetic profiling, but there are some features that don't really need it so much (ahem...all those blond Lannisters). Although, considering the protection and money you get from being a Lannister, the importance of being related to the Targaryens, and if you are a child of Robert Baratheon, it is probably good to know your genetic make up a bit better.
Way back in Season 1, Eddard "Ned" Stark started investigating the death of Lord Jon Arryn. This led him to The Lineages and Histories of the Great Houses of the Seven Kingdoms, an old book detailing the sigils, lineages, and appearances of the members of each noble House. This ultimately lethal path culminates in three simple words: "Black of hair..." Words that not only spelled out death for Ned but also led to the demise of most of his relatives. Ned was actually very clever, taking those words and employing the same logic behind those lovely Punnet Squares we all had to learn in biology class, drawing conclusions about Baratheon and Lannister genetics. A genotype from phenotype approach, if you will.
In the above comic, we are assuming that Robert was homozygous dominant (BB) for black hair. Had there been a relative that passed on a recessive blond hair allele (b) to him then he would be heterozygous (Bb) for the hair color trait. As a heterozygote, Robert would have black hair, but each of his children from a homozygous recessive (bb) mother would have a 2 in 4 chance of being blond. It is important to point out that this fifty percent chance is applied to each child independently, not that half of his children would be blond.
When it comes to an evidence-based conclusion, Ned didn't exactly have a large sample size. Considering Robert's philandering ways, the number of children produced was most certainly very large. But, Ned only looked at Cersei's children (Joffrey, Tommen, and Myrcella...all blond), the story of Cersei's first child (deceased...black hair), Gendry (black haired bastard of Robert by a tavern wench - her hair color unknown), and (sorta) Barra (bastard child by Mhaegan - a blond - of Petyr Baelish's employ). If Robert was homozygous dominant (BB) and the mother of each of his children was homozygous recessive (bb) then 100 percent of his children would be heterozygous (Bb) and black haired.
That said, Ned did have a good source in the Lineages and Histories book that describes all members of House Baratheon as "black of hair," except for the "golden headed" Joffrey (some minor TV vs. book differences here, but that lead to the same conclusions on my and Ned's part). By all members, I'm assuming this counts siblings, aunts, uncles, cousins, etc. Had there been a blond in there somewhere it would have given more credence to the heterozygous argument.
For the sake of length, and the fact that I really just wanted to post that funny little comic, I kept things simple. Genetics is oh-so-much-more complicated. If you want to read more about the genetics of Westeros then I'll draw your attention to two very well written articles over at Mad Art Lab:
The first nicely lays out the argument that "after enough generations of marrying into families like Lannister and Targaryen, we would expect some of the Baratheon kids to have blond hair, but they don't. That doesn't sound like Mendelian inheritance. What it does sound like is another phenomenon, called paramutation."
check out Genetics in Game of Thrones: "The Seed is Strong"
The next brings up many of the same points that I do. However, it spends more time asking what if you could look at the genes of the families? Essentially, what if we could give Robert, Cersei, Jamie, their children, etc. paternity tests? And how do you interpret the results?
check out Genetics in Game of Thrones: Forensics
And finally, for all you need to know about Game of Thrones check out the Game of Thrones Wiki
Wednesday, March 5, 2014
Science Heroes
I recently received this video in a promotional email by Life Technologies. I haven't posted a creative, sciency ad in a while. Although, I've yet to find an ad that surpasses BioRad's The PCR Song or even Eppendorf's epMotion ad.
Wednesday, February 12, 2014
Fun with Fundulus: The Evolution of Pollution Resistance in Killifish
 |
| (credit to Evan D'Alessandro, Rosenstiel School of Marine and Atmospheric Science) |
Let me start by introducing you to today’s study organism: The mummichog (Fundulus heteroclitus) is a species of non-migratory killifish found along the Atlantic coast of North America. They can be found in the brackish waters of tidal creeks, saltwater marshes, and estuaries. These fish are remarkably hardy, adaptable, and easy to study. Throughout the decades, a great deal of knowledge has been gathered about their life history, genetics, behavior, and endocrinology. They have also been used to study embryological processes and responses to chemicals and toxins. The mummichog’s adaptability to varying temperature, salinity, and oxygen along with their ability to survive in highly polluted areas has made them a popular subject in toxicology.
We know that animal populations adapt to environmental stressors through genetic and epigenetic (heritable changes in gene activity that are not caused by changes in the DNA sequence) changes. Changes that, in turn, affect gene expression and/or protein function. In this way, toxic chemicals can drive selection. A big part of the field of toxicology is understanding the molecular basis of these changes as natural populations adapt to altered environments. The mummichog’s ability to live in grossly contaminated waters has been used to better test and understand the molecular mechanisms by which natural populations adapt to long-term, multi-generational exposure to pollution.
Toxicologists, like geneticists, seem to love acronyms. And once you start reading chemical names, you know why. So let’s get some chemical terminology out of the way first. There are several chemicals that are under the umbrella of “dioxin-like compounds” (DLCs) which are by-products of various industrial processes and are all highly toxic. Aromatic hydrocarbons such as polychlorinated biphenyls (PCBs), polychlorinated dibenzo-p-dioxins (PCDDs), and polycyclic aromatic hydrocarbons (PAHs) all cause toxicity similar to 2,3,7,8-tetrachlorodibenzo-p-dioxin (TCDD) and DLCs. This toxicity manifests as interference in embryonic development, reproductive problems, immune impairment, and other not-so-pretty consequences.
A new study in BMC Evolutionary Biology takes a look at the Fundulus of New Bedford Harbor, Massachusetts. This 18,000 acre estuary and seaport is one of the EPA’s Superfund sites. It is highly contaminated with PCBs and heavy metals. Through their various stages of development and into adulthood, the killifish of these waters are less sensitive and/or resistant to the effects of the toxins. The researchers took a candidate gene approach to investigate the molecular basis of this adaptation to DLCs. To do this, they went to New Bedford Harbor and other polluted sites to collect fish. They also collected from reference sites where the PCB sensitivities of the killifish have been characterized and measured. Their methods included a lot of genetic work that, for the sake of space and sanity, I’m not going to detail. Let’s just skip along to the results shall we?
The researchers found a repeated evolution of resistance to DLCs in widely separated populations of Fundulus along the east coast of the U.S. There is strong evidence that this adaptation involves altered sensitivity of the aryl hydrocarbon receptor (AHR). Genes encoding proteins in the (AHR)-dependent signaling pathway are a master regulator of responses to many of the most toxic DLCs. The AHR is a ligand-activated transcription factor that exhibits high affinity for DLCs, regulates the expression of a large set of genes in response to DLC exposure, and is required for TCDD or PCB toxicity in fish (and mammals too). Two paralogs (or clades) of the AHR pathway have been identified in mummichog, AHR1 and AHR2, as well as an AHR repressor (AHRR). The loci (gene locations) for these three genes were found to contain a large number of polymorphisms, many of which encoded changes in amino acids. Perhaps most interesting was AHR2, the predominant form expressed in many fishes which has 951 amino acids whose variants lead to 26 different forms of the protein. The genetic diversity at these the three loci was not significantly different between contaminated and reference sites except in the case of AHR2. This paralog had significant FST values (the fixation index that measures population differentiation due to genetic structure) and showed very low nucleotide variability (0.1%).
So what's happening here? When polluted sites are compared to reference sites there is similar genetic diversity. However, when you look at specific nucleotides you see a story start to emerge. AHR1, AHR2, and AHRR are resistance genes that mediate toxic effects, and populations of killifish exhibit strong genetic structure at all three of these loci. The selection observed at AHR1 and AHR2, specifically the latter, at the highly polluted New Bedford Harbor site suggests an adaptation to the PCBs present there. AHR2 seems to be one of the genes, possibly the major one, involved in this resistance and may be one of the recurring targets for selection during local adaptation to DLCs. This adaptation allows the mummichog to survive in a really polluted environment. These results are consistent with several lines of evidence from similar studies both in the field and the lab.
Witnessing, quantifying, and mapping these mechanisms greatly advances our understanding of the consequences of environmental toxins. Overall, this is a very interesting example of adaptation in an ever changing environment.
Adam M. Reitzel, Sibel I. Karchner, Diana G. Franks, Brad R. Evans, Diane Nacci, Denise Champlin, Verónica M. Vieira, & Mark E. Hahn (2014). Genetic variation at aryl hydrocarbon receptor (AHR) loci in populations of Atlantic killifish (Fundulus heteroclitus) inhabiting polluted and reference habitats BMC Evolutionary Biology, 14 (1) DOI: 10.1186/1471-2148-14-6
Read more about this study in the Woods Hole Oceanographic Institute's New Release "Solving An Evolutionary Puzzle New Bedford Harbor Pollution Prompts PCB-Resistance in Atlantic Killifish"
(also the source of the above image)
EPA's New Bedford Harbor Superfund Site page
And you can learn more about how the mummichog became a model organism here:
Atz, J. W. 1986. Fundulus heteroclitus in the Laboratory: A History. Amer. Zool. 26(1): 111-120. DOI: 10.1093/icb/26.1.111 (LINK)
Tuesday, February 4, 2014
Monday, January 27, 2014
Pinpointing the Pollen: Honeybees and a Host Jumping Virus

Lately I've been revisiting some of my past topics and continuing the story with new research. Such is the case today. A relatively popular post of mine from 2010 called The Buzz on the Bees described a study from that year by Jerry Bromenshenk et al. investigating Colony Collapse Disorder (CCD). CCD describes the mysterious, sudden and serious die-off seen honeybee (Apis mellifera) colonies across the U.S. It is characterized by sudden colony death with a lack of adult bees in front of the die-outs. Honey stores and recent brood rearing are often evidenced, and sometimes the queen and a small number of survivor bees remain. The 2010 study found CCD colonies to contain an iridescent virus (IIV) (Iridoviridae; a DNA virus) that tracks with the microsporidia, Nosema apis and N. ceranae (specifically the latter), when compared to healthy colonies. This and previous scientific studies, using sensitive genome-based and proteomic methods, have also found small RNA bee viruses. These RNA viruses, alone or in conjunction with other pathogens, have frequently been implicated in CCD.
A new study published a couple of days ago in mBio by Ji Lian Li et al. correspondingly takes a look at the role of viruses in CCD. Evidence from previous studies shows that viruses that cause common infections in honeybees also infect other hymenopteran pollinators. A study published by Singh et al. (2010) even showed these viruses to be present and infective in pollen pellets.
I’ll conjecture that if you ask most people you’ll find that they don’t really think of plants as capable of getting viruses. That is until some disease comes and kills all of the fruit trees in their back yards. But plant viruses are like other viruses, obligate intracellular parasites, and they require a way to transmit from one plant to another. As you may have noticed, plants don’t generally get up and move around. This means that their viruses need a vector. Generally, these vectors are herbivorous insects. These insects are carriers, usually by carrying around infected pollen spreading the virus from one plant to another without themselves getting sick. To date, only a few plant viruses are known to also affect their insect vectors.
Li et al.’s new study takes a closer look at the role of pollen in virus transmission in honeybees. Initially, they carried out a study to screen bees and pollen loads of bee colonies for the presence of frequent and rare viruses. This resulted in the chance detection of a plant virus, tobacco ringspot virus (TRSV). This virus is a type species of the genus Nepovirus within the family Secoviridae, and it is known to infect a wide range of herbaceous crops and woody plants. Like other members of this genus, TRSV has a bipartite genome of positive-sense, single-stranded polyadenylated RNA molecules, RNA-1 and RNA-2, encapsidated in separate virions of similar size. For you non-biologists, this basically means that the virus has two genome segments/virus particles and can be directly translated into the desired viral proteins by the host cell. RNA viruses typically mutate very fast and are really good at working around host defenses (HIV and hepatitis are good examples of RNA viruses).
It is known that honeybees transmit TRSV from infected plants to healthy ones, but its presence in the researchers' screens got them to wondering if this plant virus could cause systemic infection in the exposed honeybees. To answer this, they collected adult worker bees, samples of the pollen being processed by a colony, and the ectoparasitic mite Varroa destructor (great name!) within the hive. They assessed 10 colonies for 1 year, classifying them as strong or weak based on the size of adult populations, amount of sealed brood, and presence of food stores. From their samples they purified virus particles from the adult bees and used them for cDNA library construction, virus-specific primer design, total RNA extraction, conventional RT-PCR, in situ hybridization, cDNA sequencing, and a phylogenetic analysis.
The observations of the colonies revealed an increase in bee deaths starting in the autumn and peaking in the winter. The researchers found both TRSV and IAPV (Israeli acute paralysis virus, common in honeybees) to be absent in colonies classified as strong, but both were found in weak colonies. Weak colonies too were found to have more multiple virus infections. These weak colonies were the ones less likely to survive through the cold winter months. Additionally, TRSV of the same strain was detected in the mites of infected colonies suggesting they obtain it from their bee hosts.
These results are the first evidence that honeybees exposed to virus-contaminated pollen can also be infected and that the infection can be systemic and spread throughout their entire body. Any host jumping is not without its challenges. In order for a virus to jump to a new host it must have the opportunity to come into contact with a perspective host, undergo genetic changes so that it may enter a new type of host cell, and gain the ability to spread horizontally between individuals within the new host populations. It seems that TRSV has been successful in overcoming all of these challenges. Its presence in the mites suggests that they could be a vector for the horizontal transmission between colonies. However, food-borne transmission (via pollen) is the most important route for transmission. Their results suggest that TRSV is neurotropic (affecting the nerves) in the honeybees, potentially causing severe functional impairment of nerves and muscles.
Do these results definitively conclude that TRSV is the cause of CCD? Well, no. But this study does add to a growing body of evidence that implicate parasites and pathogens as the key culprits.
Ji Lian Lia, et al. (2014). Systemic Spread and Propagation of a Plant-Pathogenic Virus in European Honeybees, Apis mellifera mBio, 5 (1) DOI: 10.1128/mBio.00898-13
NY Times article: "Bee Deaths May Stem From Virus, Study Says"
Also, check out these links for more information on Colony Collapse Disorder:
Mid-Atlantic Apiculture Research and Extension Consortium (MAAREC)
United States Department of Agriculture: Agricultural Resource Service
United States Department of Agriculture: National Agricultural Library
The Ohio State University's Agriculture Network Information Center's Bees and Pollination Page
(image via Wikipedia)
Monday, September 30, 2013
Larks vs. Night-Owls: What Your Sleep Patterns Say About You

Ugh, Monday morning really kicked my butt. Even my strong coffee failed to wake me up completely. Of course, I drag-ass most mornings, being almost useless before 10 a.m. On the flip side, I have always been wonderfully alert and productive after 7 p.m. A night owl I am, and this seems like a good topic for discussion. What determines your circadian rhythms and what does that mean for your personality?
A circadian rhythm is an endogenous, near 24 hour cycle in the process of living organisms (plants, animals, fungi, cyanobacteria). They have clear patterns and are important in determining physiological processes and activities. They are adjusted to the local environmental cues, like the light-dark cycle. I point this one out specifically because we are looking at the sleep-wake rhythm. Now, as with all things, there are individual variations, and a diurnal preference (or “morningness-eveningness (M-E) dimension” or nocturnality) is one of them. Your preference categorizes you into one of two chronotypes: (1) a lark or early riser who goes to sleep early in the evening and wakes up early in the morning or (2) a night owl who goes to sleep late in the evening and wakes up late in the morning.
Did you know that this preference is actually genetically controlled? Yeah. A paper published in Science in 2007 by Godinho et al. used N-ethyl-N-nitrosourea (ENU) mutagenized mice and screened alterations in circadian wheel-running activity. These screenings revealed a group of animals with a longer than average circadian period. They named the mutant gene “after hours” (Afh) and mapped the dominant phenotype. Then they selected those mice displaying the most extreme circadian phenotype for a genome scan. This scan revealed that the Afh mutation results in the substitution of serine for Cys358 (C358S) in Fbxl3, an F-box protein with leucine-rich repeats. Basically, Afh is a variant of the Fbxl3 gene, one of a large gene family that controls the breakdown of specific proteins in the body’s cells. After the identification of this variant, the researchers looked at the circadian expression profiles using in situ hybridization, immunohistochemistry, and Western blotting. They found that Afh affected steady-state levels of the principal negative-feedback regulators of the clock (Period genes Per1 and Per2, Cryptochrome gene Cry1, and the positive regulator Bmal1). One of the key components was the Cry1 gene which delayed the Cry protein breakdown, slowing the molecular feedback loops and lengthening the circadian cycle.
Now that we have our genotype (and resulting sleep-wake phenotype) explanation, let’s move on to personality traits. There is a rather expansive amount of literature showing that larks exhibit optimal cognitive function earlier in the day and night owls later in the day (hmmm…maybe I can coin the term “morning drag-ass syndrome”? MDAS? Pronounce that Midas because it’s gold!) A paper published in 1999 by Roberts and Kyllonen examined these cognitive differences, notabally intelligence, in a study of 420 participants. The participants were United States Air Force recruits undergoing their six week basic training and, as such, had known, homogeneous sleep-wake cycles, dietary intake and social constraints. These recruits completed two self-report measures of circadian type (Morningness-Eveningness Questionnaire and Composite Circadian Scale), a standardized intelligence test (Armed Services Vocational Aptitude Battery or ASVAB), and a standardized memory and processing test (Cognitive Abilities Measurement Battery or CAM-IV). The results of this study showed that night owls scored higher in measures of memory, processing speed, and general intelligence. I almost feel like I need to insert an immature, raspberry-accompanied I’m-smarter-than-you dance in here. Almost.
Admittedly, this final topic was the genesis for this post. I came across a newly published paper about the “Dark Triad” and just had to stop and read it. I mean, Dark Triad? Sounds like something Harry Potter might battle. Basically, the Dark Triad is a psychological term that describes a set of traits that include the tendency to seek admiration and special treatment (narcissism), to be callous and insensitive (psychopathy), and to manipulate others (Machiavellianism). Lovely. Granted, there are other determinations (google The Dirty Dozen Scale….awesome name!), but summing them all up gives you a picture of a person who is basically a giant toolbag. And there is some evidence suggesting there may be a genetic correlation to these traits. This new paper by Jonason, Jones, and Lyons looks at how the Dark Triad may be associated with the night owl chronotype. They had at 263 participants take online assessments that measured the three traits as well as the Morningness-Eveningness Questionnaire. The results of this study showed a correlation between being a night owl and the Dark Triad. The authors do a pretty good job at attempting to explain why this is so, hypothesizing that these Dark Triad traits may be evolutionarily important. They posit that these traits may give some type of night-time specialization, facilitate a cheater strategy, and enable a protean social style. They did not find any sex differences which eliminates sexual selection from their argument. This is sad because they were only able to use male “night-time adventures” once in their explanation. An overall interesting study that both allowed me to say Dark Triad a lot while removing all want to immaturely dance around.
If you have stayed with me this long then I commend you! In my defense, you did get three papers instead of the usual one. But anyway, what are we to take from all of this? That because I’m a night owl I am also an intelligent jerk, and that I can’t help it because it’s all genetic? Oh dear, I hope not. While I like to think I am intelligent, I hope that I am not a narcissistic ass-hat. So, what I guess that I’m saying is take of this what you will, and maybe read more studies.
Sofia I. H. Godinho, et al. (2007). The After-Hours Mutant Reveals a Role for Fbxl3 in Determining Mammalian Circadian Period Science, 316 (5826), 897-900 DOI: 10.1126/science.1141138Richard D. Roberts, & Patrick C. Kyllonen (1999). Morningness±eveningness and intelligence: early to bed,
early to rise will likely make you anything but wise! Personality and Individual Di€fferences, 27, 1123-1133 DOI: 10.1016/S0191-8869(99)00054-9Peter K. Jonason, Amy Jones, & Minna Lyons (2013). Creatures of the night: Chronotypes and the Dark Triad traits Personality and Individual Di€fferences, 55, 538-541 DOI: 10.1016/j.paid.2013.05.001(image via the Sleepio blog)
Friday, August 23, 2013
Monday, August 19, 2013
Eating and Evolution: Are Prey Preferences Causing the Evolution of Killer Whales?

When I was an undergrad, a lowly freshman who just knew she wanted to study biology, I took an internship at SeaWorld Orlando. I was excited that I got to participate in a real research project doing actual sciency stuff. The project was on the nursing behaviors of captive baby killer whales. Really cool right? Little did I know that actual science is composed of hours upon hours of tedious observation and documentation (2:00pm – melon bumping, 3:00pm – melon bumping, 4:00pm – melon bumping…). Despite that (or, who knows, maybe because of it), it was an neat project that boosted my interest research biology. And I got to watch killer whales for hours every week. So when I came across the paper for today’s post it really reminded me those times.
A new study published in the Proceedings of the Royal Society B, Biological Sciences looks at niche variation within sympatric killer whale populations in the North Sea. Those of you familiar with the terminology I just used might want to skip to the next paragraph. Otherwise, let’s hit a few terms first. We’ll start with the niche variation hypothesis. In the simplest terms, a niche describes where a species lives and the roles it plays in its habitat. The niche variation hypothesis describes differences within a species that are correlated with the variety of foods and habitats that are used by various populations. For example, why do island birds of the same species have different bill sizes? Likely because their bills adapt to the food items they are exploiting on their own island. It conveys a competitive advantage which results in a reproductive advantage that will lead, eventually, to an evolutionary change. This change will likely be a speciation event. This is a lineation-splitting event that produces two or more separate species from one (think about the branching on the tree of life). Usually we think of speciation as occurring via a geographic isolation (birds on different islands, populations separated by a mountain range, etc.), but the niche variation hypothesis allows for sympatric speciation because the exploitation of different resources splits a population within the same habitat. Admittedly, this type of selection would need to be really strong and stable over a long period of time to cause speciation. Now on to the study!
Killer whales (Orcinus orca) are actually members of the dolphin family (Delphinidae). They are the most widely distributed cetacean species in the world and are top marine predators. Males typically live about 30 years on average, and females about 50 years. The diet of killer whales is often geographic or population specific. Populations of orcas are usually defined as either “residents” or “transients.” As the name suggests, residents tend to stay in a more localized area whereas transients travel over large distances, sometimes overlapping with the ranges of resident populations. It has been documented that these different types of populations vary greatly in their diets, each consuming a narrow range of prey. Residents feed primarily on fish while transients feed nearly exclusively on other marine mammals. Considering this, and what we know of how the niche variation hypothesis cause speciation, have or are killer whales branching in to two species?
One of the problems in answering this question is the long-lived nature of these animals. It’s difficult to see a long-range change on a long-lived species. Most evolutionary studies use either comparisons at a single point in time or over timescales representing one to a few generations. Okay, that’s pretty good, and these snapshots have been very informative, but to get a real-time view in a long-lived species you really need to go small. And by that I mean molecular. Ancient DNA (aDNA) and stable isotope data from subfossil (remains that have not completed the fossilization process) specimens can be used to track niche and evolutionary history. The scientists in this study used these methods to look at the evolution in sympatric killer whale populations in the North Sea. First, they sampled 23 subfossil killer whale bones and teeth recovered by dredging or trawling the Southern Bight of the North Sea or from archaeological sites in Southern Scandinavia. Then they dated their samples using radiocarbon techniques or archaeological context. Next, they used stable isotope ratios to provide a long-term measure of what the animals ate during their lifetimes and thereby estimate the orcas’ niche width (it is argued that populations in wider niches are more variable than populations in narrower niches). Additional evidence of these dietary habits was gathered from examining the wear-patterns on the teeth (for example, feeding heavily on herring badly wears down the teeth). Then mitochondrial DNA (mtDNA) sequencing was used to determine the degree of linage sorting (separate populations carry their genetic diversity with them) based on isotopic (prey) niche. And finally, they biopsied the skin of modern orcas, sampling either while the animals fed on fish or on stranded remains with known stomach contents. From this they were able to extract high-quality DNA and conduct an individual-based analysis of population structure. This, combined with the aDNA data, effectively gave them a map of the evolutionary outcome of niche variation.
This is one of those studies where the results are all variable. *sigh* ‘Tis science. From the isotopic analysis, the researchers found a lot of overlap in the results, mostly likely explained by among-individual differences. Because this type of analysis represents what an animal ate over its lifetime, differences in prey items within the diets of individuals are not apparent. This and the analysis of tooth wear suggests some overlap either in the diet and/or foraging method of the specimens studied. The result is consistent with the observations of the modern whales. Fish eating pods are often found with mammal remains in their stomach contents. Lineage sorting of mtDNA sequences based on the isotopic values revealed that there “has been multiple diversifications [sic] in isotopic niche” and “an indication there was relatively stable transmission of isotopic niche along matrilineal lines within some clades, in particular those that were dominated by samples from Norway.” The incomplete lineage sorting they found seems to be consistent with relatively recent divergences in niches, and their models indicate panmixia (random mating) between at least some groups that feed on fish and some groups whose diet includes seals.
To sum up, we know that there is niche variation in populations of killer whales. But all of that variation and overlap that the researchers found suggests that any speciation is still at an early stage in this system. And while the results of this study seem to be all over the place, it does add more information to the story while providing a useful long-term evolution study methodology. It also strengths the argument that sympatric speciation is difficult to achieve.
Also check out this great presentation on this study!
Foote, Andrew D., Newton, Jason Newton, Ávila-Arcos, María C., Kampmann, Marie-Louise, Samaniego, Jose A., Post, Klaas, Rosing-Asvid, Aqqalu, Sinding, Mikkel-Holger S., & Gilbert, M. Thomas P. (2013). Tracking niche variation over millennial timescales in sympatric killer whale lineages Proceedings of the Royal Society B, Biological Sciences, 280 (1768) DOI: 10.1098/rspb.2013.1481
Science's article "North Atlantic Killer Whales May Be Branching Into Two Species"
For more information and explanation of some of the evolutionary terms discussed this post see:
Understanding Evolution via Berkeley, particularly the page on sympatric speciation
and for a nice description and examples of niche variation see
Soule, M. and Stewart, B.A. (1970) The "Niche-Variation" Hypothesis: A Test and Alternatives. The American Naturalist, 104(935): 85-97. (LINK)
Some useful resources for information on killer whales:
NOAA Fisheries Office of Protected Resources page on Killer Whales
National Marine Mammal Laboratory's page on Killer Whales
Cascadia Research Collective's "Studying the diet of fish-eating killer whales"
(image via National Geographic, photo credit Gerard Lacz/Animals Animals—Earth Scenes)
Thursday, August 1, 2013
Heavy Metals in Fish: Toxicity and Tolerance

Today I found an interesting paper that fits right in to my new job in the field of aquatic ecotoxicology. As the name suggests, this field is a combination of ecology and toxicology that deals with the nature, effects, and interactions of harmful substances in the environment. In my case, it is aquatic, freshwater systems in particular. The paper I came across looks at the effects of metal contamination and tolerance in freshwater fish.
Metal contamination is something that occurs worldwide. A number of industrial metals (particularly copper, cadmium and nickel) have been well studied in freshwater systems. These studies have used gradients in contamination to demonstrate correlations between chronic metal exposure and physiological changes that occur as a result of the toxicity. These changes can include alterations in various metabolic processes as well as impaired growth and reproduction. This study focuses on how wild brown trout (Salmo trutta) respond when exposed to a water-borne mixture of metals.
The researchers looked at the brown trout that inhabit the River Hayle in Southwest England. Historically, this area has been mined, peaking during the 1800s. The drainage from these mining operations contaminates the river with a mixture of metals, and the middle region of the River Hayle is known to have extremely high metal concentrations. So high that few fish or invertebrates are able to live there. However, brown trout migrate between the upper and lower sections, including this area. Trout found in the lower regions of the river have been shown to have acute metal toxicity, including total zinc, copper and iron which average 639, 42 and 200 ug/L respectively. Despite these high levels, the fish are able to sustain a population with no evidence of reduced genetic diversity. The aim of this study is to figure out how this tolerance of metals is possible.
To answer this question, the researchers used an integrative approach, combining genomics with the analysis of metal accumulation in tissues. They collected embryo and adult fish from the metal-polluted River Hayle and their control, the River Teign. In the adults, the researchers sampled portions of gill, gut, kidney and liver tissues and processed them to measure the concentrations of seven metals: copper (Cu). lead (Pb), zinc (Zn), arsenic (As), cadmium (Cd), iron (Fe), and nickel (Ni). Since there is relatively little gene sequence information on brown trout, they then had to sequence, assemble and annotate transcriptome (the set of all RNA molecules [mRNA, rRNA, tRNA, and non-coding RNA]). I think you'll thank me for not going in to how they do that (if you are interested in these methods, the paper lays them out nicely), but suffice it to say it is laborious but informative. Then they performed a functional analysis for differentially expressed genes from each tissue.
When the researchers compared the metal concentrations they found all seven metals to be significantly higher in the Hayle trout than the Teign trout. Across all metals the fold change was highest in the gills (62.6-fold change) followed by the liver (33.7-fold change) then the kidney (18.5-fold change). They found no significant differences in the gut. This suggests that the gills are the primary uptake route for these metals. That makes sense considering the large surface area in direct contact with the water and the abundance of uptake carriers and transporters for these metals. After the metals are taken in by the gills, they are transported in the bloodstream to the rest of the body, accumulating in the liver and kidney. As these organs are responsible for processing, detoxification, storage and excretion it is easy to see why accumulation might happen here.
In both rivers, zinc was the most abundant metal in the gill, gut, and kidney, while copper was found to be highest in the liver. They also found zinc and copper to be the ones that increased to the greatest extent in the gills, liver and kidney. That's logical when you consider that these two metals were the ones elevated to the greatest extent between the two rivers (60- and 40-fold, respectively). They also found evidence that may link the uptake, storage and metabolism of iron, cadmium, and arsenic.
In order to identify potential mechanisms of toxicity and/or tolerance to these metals, gene expression patterns for the four selected tissues were examined in fish from both rivers. A total of 998 transcripts were differentially exposed in at least one tissue. You should expect the activity of the components involved in the body's metal homeostasis system (that ensures an adequate supply of essential [trace] metals) to change with increased metal exposure. And indeed, the researchers found at least one MT (glutathione and metallothioneins; act as buffers for metal ions entering cells and have an affinity for most metals), particularly metallothionein b, to be the most strongly up-regulated genes in the Hayle trout. This suggests that the trout's metal tolerance mechanism may be as a result of the sequestration of metals by MT. And although zinc and copper were found to be in the highest concentrations in tissues, only the zinc transporter gene was differentially expressed (down-regulated in the kidney). However, they did find changes in iron-metabolism related genes. Since metals also disrupt the balance of ions in the body causing oxidative damage, the researchers also looked at the ion homeostasis system. They found differential expression of enzymes and a number of other genes encoding proteins that are important in maintaining ion balance.
All of this put together gives some interesting mechanisms of metal toxicity, demonstrating that these fish have developed strategies for dealing with the pollution in their environment.
Uren Webster, T. M., Bury, N.R., van Aerle, R., & Santos, E.M. (2013). Global transcriptome profiling reveals molecular mechanisms of metal tolerance in a chronically exposed wild population of brown trout Environmental Science & Technology DOI: 10.1021/es401380p(image via Biopix)
Friday, April 19, 2013
The Curious Case of the Earworm (Part 1)

I have had “Thrift Shop” stuck in my head for what seems like days.Yes, it is always on the radio, and yes, I usually listen to it when it is playing. Don't judge me. But why (*Stella scream* wwhhhhyyyyy!) has it established a permanent residence in my brain? I’m going to use a few studies to make the case that it isn’t my fault; I’m led around by my biochemistry. Basically, I’m blaming it on my neurons.
Hmmm…where to start. Let’s try to figure out why we like a song (or music in general) in the first place. A study by Valorie Salimpoor et al. in 2011 suggests that it comes down to the biochemistry of pleasure. We, as humans, as animals, find many things in our lives to be pleasurable. Why is this? Well, our brain tells us so. Pleasure is, in essence, a reward for a good stimulus. In the brain, it is largely mediated by dopamine, which also works to reinforce and motivate these behaviors. Now, most people will agree that music is a pleasurable stimulus, but as an abstract stimulus (one not directly related to survival) is it regulated by the same dopamine pathways? In this 2011 study, subjects were asked to select their own “highly pleasurable music” to play for these tests (since musical preferences are so individualized). Then the researchers used PET scanning to estimate dopamine release. Since there are physiological changes that occur during moments of extreme pleasure, they also used the “chills” or “musical frission” response, an objective phychophysiological measurement of clear and discrete patterns of autonomic nervous system arousal. To tease out the response to the music versus the anticipation of the music, they combined the temporal specificity of functional MRI (through the temporal profile of blood oxygenation level - BOLD) with the neurochemical specificity of the PET scan.
Salimpoor's group found that the pleasure experienced when listening to music is associated with dopamine activity, that there was a positive correlation between the intensity of “chills” and dopamine release, and an increased BOLD response. In fact, dopamine levels surge during key passages of favorite music and just in anticipation of it. This release is pivotal for establishing and maintaining the behavior, making listening to music a valued experience.
Ok, biochemistry…check. Let’s go bigger: What parts of your brain light up when you hear music you like? Salimpoor et al. has published a new study in the April 2013 edition of Science that looks at neural processes active when this pleasurable musical event is happening. Specifically, they look at the reward value the first time a song is heard. We now know that dopamine is involved in familiar music, so what about previously unheard music? To test this, the researchers recruited people, asked them to share their musical tastes (“indie” and “electronic” were the most popular), and used music excerpts selected from a music-recommendation software to pick a unheard song within that preference. To assess reward value, to see if participants liked a song enough that they wanted to hear it again, they were given the option purchase the music with their own money (I know if I have to use my own money then I make sure I love it). Then the participants underwent fMRI scans while listening to musical excerpts and were asked to provide bids of how much they were willing to spend for each song.
The researchers found that the reward value (amount of the bid) was directly related to the region of the brain associated with positive prediction error (the NAcc for you brain folks), or pleasant surprises. Increased functional connectivity with this region was made with the auditory cortices, the region known to play a role in the retrieval of previously stored sound information (STG), and the areas implicated in beat processing (caudate and premotor areas). Additionally, increased connectivity was found in regions associated with emotional processing and value-guided decision-making (VMPFC, OFC, and amygdala), but only when sounds gain reward values. When added to the dopamine findings, the activity in these brain regions suggests that when you hear new music your brain looks at its stored information about sound relationships and makes a decision on whether or not to like it based on previous listening experiences and the expectations of tonal events associated with that type of music. If you like it, then your brain gives you a pleasure reward and you end up using your money to buy the song (or otherwise find ways to hear it again). If you like it better than you expected, you get even more delight.
Now we know why we like the song and want to hear it again (and again and again…).In the next post we will go further and explore what turns this likeable song into an earworm. Or is it its likeablity at all? (insert cliffhanger music here…dun dun duuuunnnn…)
Salimpoor, V., Benovoy, M., Larcher, K., Dagher, A., & Zatorre, R. (2011). Anatomically distinct dopamine release during anticipation and experience of peak emotion to music Nature Neuroscience, 14 (2), 257-262 DOI: 10.1038/nn.2726
Salimpoor, V., van den Bosch, I., Kovacevic, N., McIntosh, A., Dagher, A., & Zatorre, R. (2013). Interactions Between the Nucleus Accumbens and Auditory Cortices Predict Music Reward Value Science, 340 (6129), 216-219 DOI: 10.1126/science.1231059
...and an article in ScienceNOW "Why Your Brain Loves That New Song"
(image via rockandtheology)
Friday, March 22, 2013
They're All Alike: The Giant Squid Conundrum
I wasn’t going to post on another paper this week but then two things happened: I saw the video of the first giant squid filmed in its natural habitat (those scientists get so excited!), and I saw the study about giant squid diversity. I posted the first above and now we'll take a look at the second.
The giant squid (Architeuthis spp.) is one of the largest invertebrates and lives in the deep sea. It was first described as Architeuthis dux in 1857 by Danish naturalist Japetus Steenstrub, but since then, as many as 21 nominal species of Architeuthis have been described. The descriptions of this creature have primarily come from remains found washed up on beaches, found floating on the ocean surface, caught by deep-sea trawling activity, or in the stomachs of sperm whales (Physeter macrocephalus). It wasn’t until 2004 that a live specimen was observed in its natural habitat, and earlier this year that the first video footage was published (although not the in-the-natural-habitat version above). It is estimated that female squid reach a total length of 18m (59ft) and males reach slightly smaller sizes. The giant squid is globally distributed, with the exception of polar regions. They feed primarily on fish and smaller cephalopods. Studies of carbon and nitrogen isotope profiles of the upper beaks suggest ontogenetic diet shift earlier in life (smaller to larger prey items), and carbon isotope composition remains constant in food sources indicating that the squid inhabit relatively small, well-defined and productive areas. The predation of adult squid by sperm whales suggests that squid population size must be large enough to support such a large whale population, although this has never been proven.
There are some rather obvious difficulties in studying giant squid using conventional, observational techniques. So other techniques must be utilized. Enter, DNA. Recent advances in DNA sequencing techniques have made it easier, quicker, and more economical to sequence long stretches of DNA. The role of DNA sequencing is becoming more and more important in phylogenetic and population biology studies. It allows you to assess the number of species, examine the amount of genetic variation, and describe population structure.
In a new paper in the Proceedings of the Royal Society B: Biological Sciences, researchers collected 43 Architeuthis soft tissue samples from the carcasses of dead animals across their known range. They extracted DNA samples from the specimens to analyze the mitochondrial genomes (mitogenomes) and levels of nucleotide variation. They generated mitogeome datasets using several strategies, depending on the quality of the DNA in each sample. I’m not going to go into their sequencing methods – if you are a molecular biologist then you already know them, and if you aren’t then I’ll just bore you. To look at the population level of the genetic variance, they wanted to compare their samples with the fossil record of coleoid cephalopods. This is challenging considering the extremely limited fossil record for these organisms. So they used four different mutation rates to tentatively estimate a time of expansion and upper and lower bounds for the time of divergence of Achiteuthis from other squid families.
They were able to complete 37 complete and 6 partial mitogenome sequences. Remember up at the top of the post where I said “21 nominal species of Architeuthis have been described?” One pretty strong conclusion of this study is that there is only one species of Architeuthis that exists, namely Architeuthis dux (Steenstrub, 1857). The researchers found the haplotype diversity of these giant squid to be high at the mitogenome level, but the level of nucleotide diversity in these sequences was found to be extremely low, with only 181 segregating sites of a 20,331 base pair long sequence. Only the basking shark (Cetorhinus maximus) has a similarly low diversity, which is the result of a recent bottleneck. This diversity for giant squid is much lower than is seen in other squid, 44 times lower than Humboldt squid (Dosidicus gigas) and 7 times lower than the recently restricted population of oval squid (Sepioteuthis lessoniana). The high haplotype to low nucleotide diversity relationship is interesting because it shows that out of a very diverse phyla of animals, the giant squid is the odd one out. Looking at the species across its range, there was no evidence of any phylogeographic structure, which is odd considering the global distribution.
So how do you explain the low genetic diversity in comparison to the global distribution (and potentially large population size)? The authors hypothesize that it could be a low rate of mitochondrial DNA evolution, something that has been observed in other marine organisms. But a low mutation rate does not explain why mitogenome duplications maintain near 100 percent identity. The authors suggest that “perhaps the duplicated sequences form stable secondary structures, which are somehow selectively beneficial, thereby causing mutations to be under negative selection,” which would lead to “a decreased rate of divergence in the duplicated regions relative to the rest of the genome, which does not appear to be the case.” Alternatively, it could be a recent selective sweep such as a bottleneck. Bottlenecks are events that greatly reduce the size of a population, usually resulting in a large reduction in the genetic diversity of that group. If this bottleneck were followed by an expansion in the number of individuals in that population then you would see that low diversity spread amongst a large population. Modeling and analysis of data support the latter hypothesis over the former.
Unfortunately, genetic data alone can’t provide an answer as to why this might have happened. Whatever event it was, climatic or biological, it would have had to been wide ranging enough to affect a global population. Perhaps it was a sudden inflation of a population that was historically smaller. It is known that cephalopods tend to be subdominant predators, and as such, are affected by the changes in population of predators and competitors. If this small size was due to restraints on predators and/or competition and that restraint were released then you would expect such an inflation in squid numbers. Considering the effect of industrialized whaling in the 1700s to late 1800s, this is a likely explanation, but still too recent to explain it entirely. This change in predators and/or competitors could have been the result of climatic effects such as the last ice age changing. Such changes could have altered the abundance and distribution of competitors such as predatory fish. Or perhaps, rather than a bottleneck, A. dux existed historically as a single, small, geographically isolated population that then expanded globally. This expansion would have had to been in a non-ordered fashion with either nomadic adults or dispersing juveniles and small pelagic paralarvae capable of using currents to travel long distances. But if they can disperse really far then why would they have been restricted historically? The authors hypothesize that a global population existed for a considerable time, and that an average of just one individual exchanged between two populations per generation will be enough to prevent genetic differentiation between them. They believe that the wide ranging dispersal of paralarvae and juveniles on the currents of the upper layers of the oceans could achieve this. These young life stages float along with the currents feeding on zooplankton and such until they reach a sufficiently large size, after which they descend to the closest nutrient-rich deep habitat where they remain until maturation.
I think that’s a pretty good explanation. What about you?
Winkelmann, I., Campos, P., Strugnell, J., Cherel, Y., Smith, P., Kubodera, T., Allcock, L., Kampmann, M., Schroeder, H., Guerra, A., Norman, M., Finn, J., Ingrao, D., Clarke, M., & Gilbert, M. (2013). Mitochondrial genome diversity and population structure of the giant squid Architeuthis: genetics sheds new light on one of the most enigmatic marine species Proceedings of the Royal Society B: Biological Sciences, 280 (1759), 20130273-20130273 DOI: 10.1098/rspb.2013.0273
ScienceNOW article: "Giant Squid Worldwide Are One Species"
ScienceDump: "The search for the giant squid"
Vido via Nature's: "Giant squid filmed in its natural environment"
Wednesday, March 20, 2013
Wednesday, January 9, 2013
Karyotyping Socks
Laundry day is fast approaching my household. This got me to smile about laundry, and that is hard to do.

(via Gina Glover)

(via Gina Glover)
Saturday, March 31, 2012
There You Gogh

I spent the day getting some new hanging baskets of flowers for my porch, hoping the shade of the porch doesn't send these plants to an early grave, and cleaning said porch of the mountains of tree sperm (a.k.a. pollen) so that I could enjoy the weather without looking like I engaged in a losing battle with a horny pine tree. This is normally more time than I generally spend with the reproductive structures of plants (whole plants yes, specifically plant genitalia no), and so it put me in the flower frame of mind. Hence, today's post.
The evolution of flower shape and symmetry is of particular interest and importance because it can affect pollinator behavior. Affect pollinator behavior and you affect who is successful at reproducing. All of a sudden our cute, and even sexy, talk of flowers becomes a talk of genetics. A new paper in PLoS Genetics takes a somewhat novel approach to this question: Classic art.

Vincent van Gogh's Sunflower paintings are well known and duplicated many times by many artists. When you look at the paintings you notice the vibrant colors, the angles, and the detail (down to differences in petal structure). Now, I'm not an artist, art critic, or art historian. Heck, I'm proud that I can draw stick figures that don't look like they have suffered head trauma or just got a prescription for Viagra. However, I do notice elements about van Gogh's Sunflower paintings that make me go "huh." Particularly the symmetry of the flowers. Look closely. Do those look like the sunflowers that you are used to seeing? As it turns out, when van Gogh painted his famous sunflower pictures in France in 1888 and 1889, he was painting mutant sunflowers. These flowers were double-flowered (dbl) sunflower mutants in which the disc florets develop bilateral symmetry rather than their typical radial symmetry.
Actinomorphic flowers exhibit radial symmetry; No matter which diameter you halve it along the halves will be equal. This type of floral symmetry is considered to be the ancestral state. Zygomorphic flowers exhibit bilateral symmetry; They can be divided by only a single plane into two mirror-image halves. This type of floral symmetry has arisen several times during the evolution of flowering plants. Those species exhibiting this anatomy tend to be from more speciose clades, likely because the symmetry increases pollinator specificity. Common (or wild type) sunflowers have a composite flower head that has a single whorl of large, flattened yellow ray florets on the outer perimeter with hundreds of disc florets that can produce seeds. Contrast this to the dbl mutant which exhibits flowers with multiple bands of yellow florets and much fewer internal disc florets. You've got that all worked out in your mind's eye, right? Well, as described by the authors and in the terms we just defined, Vincent van Gogh's sunflowers exhibit zygomorphic
symmetry rather than the actinomorphic symmetry characterized in the sunflowers
we are used to.
So what causes this (genetically speaking) and how do you find it? Remember good ole Gregor Mendel and his pea plant experiments? Well, that's how you find it. These scientists crossed the wild type variety of sunflower with the double-flowered variety. At first they thought a single, dominant gene was responsible for the change in the flower, but subsequent crosses revealed a third flower type of intermediate form. This intermediate form results from a gene recessive to both the wild type and the dbl variety. That means that something less-simple is going on.
 |
| Figure 1: Entire inflorescences (A, C, E) and individual florets (B, D, F) from wildtype (A, B), double-flowered (C, D) and tubular (E, F) sunflower individuals. Florets are arranged left to right from the inner florets to the outer florets. (G) “Sunflowers (Still Life: Vase with Fifteen Sunflowers)” by Vincent van Gogh (1888) with double-flowered heads pointed out with arrows. |
Their next step was to sequence the genes. It is known that the genetic control of floral symmetry involves CYCLOIDEA (CYC)-like TCP transcription factors. The gradient of the expression of this gene can control the different types of petals that form. The genetic sequencing showed that dbl mutants had an insertion into the promoter region of a CYC-like gene (HaCYC2c). This is normally expressed in the wild type flowers but in dbl flowers it is expressed throughout the inflorescence causing it to lose actinomorphy. This same gene was disrupted in other types of sunflower mutants.
Very long story short: They found the genes that caused the van Gogh's mutant sunflowers. Does this change how you view the painting? Perhaps. Perhaps not. But it does solve a decades-long question, and in my book that is truly neat.
Read the paper here:
Chapman, Mark A., et al. (2012) Genetic analysis of floral symmetry in Van Gogh's Sunflowers reveals independent recruitment of CYCLOIDEA genes in the Asteraceae. PLoS Genetics: 8(3), e1002628 (DOI: 10.1371/journal.pgen.1002628)Brush up on your Sunflower's painting history at the Van Gogh Gallery
Read more over at Science Daily's article "Scientists Reveal Genetic Mutation Depicted in Van Gogh's Sunflower Paintings"
(images via Pacific Bouquets & Fine Gifts, Inc and Fantasy Art History, respectively)
Subscribe to:
Posts (Atom)
