Will the ocean ever run out of fish? To us the oceans are vast. But, in reality, they are a finite resource. Here are two videos for you to consider:
Will the Ocean Ever Run Out of Fish?:
Ending overfishing:
(note: because this was made in 2012, some of the stats are out-of-date, but the concepts still hold true)

Showing posts with label fish. Show all posts
Showing posts with label fish. Show all posts
Monday, August 14, 2017
Tuesday, February 14, 2017
I'm Back!
It has been awhile. A long long while. I know, I know. My New Year's resolution was to starting writing regularly on the blog again. Better late than never.
My only excuse for my excessively long absence is that I have been writing. So, I'll take a little me-moment to catch you up on what I've been up to:


My only excuse for my excessively long absence is that I have been writing. So, I'll take a little me-moment to catch you up on what I've been up to:
Monday, March 23, 2015
A Dottyback in Damsel Clothing: Color Mimicking in Fish

I was looking around for a study and stumbled upon one about fish mimicry in Current Biology. What first caught my attention was its use of a video abstract. What a cool idea amped up a few notches by beginning with music reminiscent of Game of Thrones. Then I started to think back about posts I've done on predator-prey relationships and could only come up with 1, the One-Third for the Birds post back in 2012. Clearly it is time to revisit that topic. Oh, and while we’re at it, we’ll throw mimicry into the mix.
Different prey species employ various options in predator avoidance including mimicry. Generally, mimicry is a strategy of looking, acting, smelling, or sounding like something else as an act of deception to gain protection. But prey species are not the only ones that mimic. Predators use it to get close enough to catch their prey. Blending into the background or looking like something familiar can be very useful in sneaking up on an unsuspecting prey animal. However, in both predator and prey, there is a huge caveat to mimicry - numbers. The mimic must be rare compared to their model. If the mimics are encountered too often then the predator/prey learns of this cunning deception and the mimicry becomes ineffective.
This month Cortesi et al. published a short paper looking at body color and predatory behavior in dusky dottybacks (Pseudochromis fuscus). This small species (8 cm) is a generally solitary and aggressive predatory reef fish native to the southwestern Pacific Ocean and eastern Indian Ocean. The fish are usually found in association with branching corals (e.g. Cauliflower corals [Pocillopora] and Staghorn corals [Acropora]), setting territories where they love to hunt and eat juvenile coral reef fish, particularly the similar-looking damselfish. Individuals range in color from yellow to a “dusky” purple/brown. The researchers based their experiments on 3 interesting facts: 1) when the dottybacks matched the color of other reef fish they increased their hunting success, 2) dottybacks have been shown to change body coloration within 2 weeks when translocated to a different, dark colored reef and 3) dottybacks aggressively mimic similarly colored adult damselfishes. Does one color work better than another? Are there cues that drive the color change?
 |
| Figure 1 (A and B) from Cortesi et al (2015) Current Biology |
To test this, they set up sites at Lizard Island, Great Barrier Reef, Australia. Ya know, given the option, that's probably where I’d do my research too. They collected dottybacks and adult damelfishes and assessed the home ranges of the yellow and brown dottyback color morphs. Then, to look at the genotypes associated with different color morphs, they used microsatellites on fin clips from fish from three lagoon locations. Next, they conducted a translocation experiment. They found an open area and created a small patch reef using pieces of live or rubble coral. A total of 15 yellow damselfish (Pomacentrus amboinensis, P. moluccensis) and 15 brown damselfish (P. chrysurus) of all size classes were placed on the patch reefs. Once the damselfish were adjusted to their new home, the dottybacks (tagged unique fluorescent elastomer markers) were added in a 2 x 2 x 2 design (dottyback color x damselfish color x habitat type, each with 2 levels: yellow/brown dottyback, yellow/brown damselfish, live coral/coral rubble). Once all of the fish were on the patch reef, they were observed for predation and body color (using spectral imaging, skin biopsys for histology, and lots of mathematical models).
The researchers also conducted a very similar experiment using controlled conditions. Damselfish and dottybacks were caught and placed into experimental aquarium tanks containing live and rubble corals. Both juvenile and adult damselfish were acclimatized to a tank before a dottyback morph was introduced. Then strike rates of dottybacks directed at the damselfish were recorded. Then they conducted a prey color choice experiment to examine if dottybacks had a preference for a particular colored prey fish, again in the experimental aquariums. Considering that dottybacks aren't just predators but also prey for larger fish, the researchers tested to see if dottybacks also benefit from matching the color of the habitat using coral trout (the predator) in controlled choice tanks.
Whew! That’s a lot of experiments for one little report paper. In the field, they found that yellow dottybacks associated themselves with live coral and yellow damselfish, and brown dottybacks associated with coral rubble and brown damselfish. The translocation experiment showed how the color of resident adult damelfish induced color change in the dottybacks in patches where their colors were mismatched, independent of habitat type. The skin biopsies showed that unlike other species of fish, the dottybacks did not achieve this change by altering the number of chromatophores (pigment containing cells that reflect ligh) but, rather, the ratio of xanthophores (yellow pigment cells) compared to melanophores (black pigment cells) alters.
In the aquarium experiments, they found that dottybacks were three times more successful in capturing juvenile damselfish when their color matched that of the adult damselfish. This bit of deception works on the fact that the juveniles are less vigilant when they perceive all bigger fish as harmless adult damselfish. The strike rates showed that dottybacks prefer to go after prey fish of the same coloration to themselves, but, when mismatched, brown dottybacks are more likely to have successful strikes than yellow ones. When the dottybacks became the prey species, coral trout were found to strike more often at fish that were color mismatched to the background. This means that the color change has a secondary camouflage benefit and possibly a dilution effect when they are associated with similarly colored damselfish.
 |
| Graphical Abstract from Cortesi et al (2015) Current Biology |
Write-up by the authors on The Conversation: "The dusky dottyback, a master of disguise in the animal world."
(image via the Australian Museum)
Wednesday, February 12, 2014
Fun with Fundulus: The Evolution of Pollution Resistance in Killifish
 |
| (credit to Evan D'Alessandro, Rosenstiel School of Marine and Atmospheric Science) |
Let me start by introducing you to today’s study organism: The mummichog (Fundulus heteroclitus) is a species of non-migratory killifish found along the Atlantic coast of North America. They can be found in the brackish waters of tidal creeks, saltwater marshes, and estuaries. These fish are remarkably hardy, adaptable, and easy to study. Throughout the decades, a great deal of knowledge has been gathered about their life history, genetics, behavior, and endocrinology. They have also been used to study embryological processes and responses to chemicals and toxins. The mummichog’s adaptability to varying temperature, salinity, and oxygen along with their ability to survive in highly polluted areas has made them a popular subject in toxicology.
We know that animal populations adapt to environmental stressors through genetic and epigenetic (heritable changes in gene activity that are not caused by changes in the DNA sequence) changes. Changes that, in turn, affect gene expression and/or protein function. In this way, toxic chemicals can drive selection. A big part of the field of toxicology is understanding the molecular basis of these changes as natural populations adapt to altered environments. The mummichog’s ability to live in grossly contaminated waters has been used to better test and understand the molecular mechanisms by which natural populations adapt to long-term, multi-generational exposure to pollution.
Toxicologists, like geneticists, seem to love acronyms. And once you start reading chemical names, you know why. So let’s get some chemical terminology out of the way first. There are several chemicals that are under the umbrella of “dioxin-like compounds” (DLCs) which are by-products of various industrial processes and are all highly toxic. Aromatic hydrocarbons such as polychlorinated biphenyls (PCBs), polychlorinated dibenzo-p-dioxins (PCDDs), and polycyclic aromatic hydrocarbons (PAHs) all cause toxicity similar to 2,3,7,8-tetrachlorodibenzo-p-dioxin (TCDD) and DLCs. This toxicity manifests as interference in embryonic development, reproductive problems, immune impairment, and other not-so-pretty consequences.
A new study in BMC Evolutionary Biology takes a look at the Fundulus of New Bedford Harbor, Massachusetts. This 18,000 acre estuary and seaport is one of the EPA’s Superfund sites. It is highly contaminated with PCBs and heavy metals. Through their various stages of development and into adulthood, the killifish of these waters are less sensitive and/or resistant to the effects of the toxins. The researchers took a candidate gene approach to investigate the molecular basis of this adaptation to DLCs. To do this, they went to New Bedford Harbor and other polluted sites to collect fish. They also collected from reference sites where the PCB sensitivities of the killifish have been characterized and measured. Their methods included a lot of genetic work that, for the sake of space and sanity, I’m not going to detail. Let’s just skip along to the results shall we?
The researchers found a repeated evolution of resistance to DLCs in widely separated populations of Fundulus along the east coast of the U.S. There is strong evidence that this adaptation involves altered sensitivity of the aryl hydrocarbon receptor (AHR). Genes encoding proteins in the (AHR)-dependent signaling pathway are a master regulator of responses to many of the most toxic DLCs. The AHR is a ligand-activated transcription factor that exhibits high affinity for DLCs, regulates the expression of a large set of genes in response to DLC exposure, and is required for TCDD or PCB toxicity in fish (and mammals too). Two paralogs (or clades) of the AHR pathway have been identified in mummichog, AHR1 and AHR2, as well as an AHR repressor (AHRR). The loci (gene locations) for these three genes were found to contain a large number of polymorphisms, many of which encoded changes in amino acids. Perhaps most interesting was AHR2, the predominant form expressed in many fishes which has 951 amino acids whose variants lead to 26 different forms of the protein. The genetic diversity at these the three loci was not significantly different between contaminated and reference sites except in the case of AHR2. This paralog had significant FST values (the fixation index that measures population differentiation due to genetic structure) and showed very low nucleotide variability (0.1%).
So what's happening here? When polluted sites are compared to reference sites there is similar genetic diversity. However, when you look at specific nucleotides you see a story start to emerge. AHR1, AHR2, and AHRR are resistance genes that mediate toxic effects, and populations of killifish exhibit strong genetic structure at all three of these loci. The selection observed at AHR1 and AHR2, specifically the latter, at the highly polluted New Bedford Harbor site suggests an adaptation to the PCBs present there. AHR2 seems to be one of the genes, possibly the major one, involved in this resistance and may be one of the recurring targets for selection during local adaptation to DLCs. This adaptation allows the mummichog to survive in a really polluted environment. These results are consistent with several lines of evidence from similar studies both in the field and the lab.
Witnessing, quantifying, and mapping these mechanisms greatly advances our understanding of the consequences of environmental toxins. Overall, this is a very interesting example of adaptation in an ever changing environment.
Read more about this study in the Woods Hole Oceanographic Institute's New Release "Solving An Evolutionary Puzzle New Bedford Harbor Pollution Prompts PCB-Resistance in Atlantic Killifish"
(also the source of the above image)
EPA's New Bedford Harbor Superfund Site page
And you can learn more about how the mummichog became a model organism here:
Atz, J. W. 1986. Fundulus heteroclitus in the Laboratory: A History. Amer. Zool. 26(1): 111-120. DOI: 10.1093/icb/26.1.111 (LINK)
Monday, October 14, 2013
Socialite in the Dark: Do Eyes Really Matter When It Comes To Schooling?

It has been a while since I've visited the topic of blind fish. I know, I know! What took me so long, right? Well, I was browsing for fish papers, ‘cause I take care of lab fish now (I’m working my way up to Fish Whisperer status), and I came across a paper in Current Biology about the schooling behavior of cavefish, specifically the effects of eyesight loss on this behavior.
There are two main types of social “collective behavior” in fish: shoaling and schooling. Shoals are defined exclusively by social attraction, simply being near each other in a group. To form a school, individuals must also maintain coordinated body position with their schoolmates, showing polarized orientation and synchronized movement.
 In a 2011 post, The Sleep of the Blind Fish, I introduced you to Astyanax mexicanus, commonly known as the Mexican cavefish or Mexican tetra. I’ll let you visit that post for more details on this species, but for today know that it has two, interfertile forms: the normal or surface form is pigmented, sighted, and has a natural photoperiod, and the blind form is albino, has no eyes, and lives in dark caves. The normal form actively groups into schools and shoals while the cave form has reduced this behavior. A study by Johanna Kowalko et al. looked to quantify this schooling behavior. To do this they made a sort of fish mobile attached to a motor. As the grouped plastic model fish on the mobile moved, the live fish had the option to join, orient with, and follow the group or not. Images and videos allowed the researchers to measure the position of the fish, average and proportion of time each fish spent with the school, and nearest neighbor distances. They found that surface fish followed the model school while cavefish did not. The surface fish swam significantly closer together than did the cavefish. Also, the cavefish showed a loss of the tendency to swim oriented to one another, or school, as well as a decreased tendency to shoal.
 |
| Greenwood et al. (2013) Fig. 1 |
Next, Kowalko's group wanted to see what was going on in the brain. Recent research has shown that surface and cavefish have different levels of monoamine neurotransmitters (signaling chemicals in the nervous system). They used inhibitors to alter serotonin and monoamines. Then they ran their schooling tests. They found that serotonin levels make no difference, but preventing the breakdown of monoamines decreases schooling behavior and results in significantly greater distances between fish in the shoaling tests. These results are consistent with other evidence that a molecule involved in the synthesis of dopamine (a monoamine) affects schooling behavior in cavefish.
Finally (whew!), they performed quantitative trait locus (QTL) analysis. Basically, this is a statistical method that links the phenotype (trait) measurements and the genotype (molecular markers) to explain a genetic basis for a complex trait. They found homozygous cave alleles at a marker underlying linkage group 27 that results in a decrease in schooling behavior and a dark preference. They also found schooling QTL that does not fall in the same place as the QTL for dark preference, eye size, pupil size, or neuromast number. This means that there is are both vision-dependent and vision-independent genetic contributions to the evolution of schooling behavior. Interesting.
Is there a story here? Well, sure. Perhaps when the sighted, cavefish ancestors arrived in their new, dark homes they couldn't school because of the lack of light. Their new cave environment also had a different ecology than their surface habitat. For one, it had a lack of big predators. Schooling equals protection in numbers, so a lack of the need of protection equals a lack in the need to school. For another, caves have scarcer food. Groups eat more and eat together. When there is less food and it is more spread out it is advantageous to find and eat it alone. Put together, this relaxed the selective pressure on schooling behavior causing multiple genetic changes, only some of which are vision-dependent.
See also:
(images via Seriously Fish)
Thursday, August 1, 2013
Heavy Metals in Fish: Toxicity and Tolerance

Today I found an interesting paper that fits right in to my new job in the field of aquatic ecotoxicology. As the name suggests, this field is a combination of ecology and toxicology that deals with the nature, effects, and interactions of harmful substances in the environment. In my case, it is aquatic, freshwater systems in particular. The paper I came across looks at the effects of metal contamination and tolerance in freshwater fish.
Metal contamination is something that occurs worldwide. A number of industrial metals (particularly copper, cadmium and nickel) have been well studied in freshwater systems. These studies have used gradients in contamination to demonstrate correlations between chronic metal exposure and physiological changes that occur as a result of the toxicity. These changes can include alterations in various metabolic processes as well as impaired growth and reproduction. This study focuses on how wild brown trout (Salmo trutta) respond when exposed to a water-borne mixture of metals.
The researchers looked at the brown trout that inhabit the River Hayle in Southwest England. Historically, this area has been mined, peaking during the 1800s. The drainage from these mining operations contaminates the river with a mixture of metals, and the middle region of the River Hayle is known to have extremely high metal concentrations. So high that few fish or invertebrates are able to live there. However, brown trout migrate between the upper and lower sections, including this area. Trout found in the lower regions of the river have been shown to have acute metal toxicity, including total zinc, copper and iron which average 639, 42 and 200 ug/L respectively. Despite these high levels, the fish are able to sustain a population with no evidence of reduced genetic diversity. The aim of this study is to figure out how this tolerance of metals is possible.
To answer this question, the researchers used an integrative approach, combining genomics with the analysis of metal accumulation in tissues. They collected embryo and adult fish from the metal-polluted River Hayle and their control, the River Teign. In the adults, the researchers sampled portions of gill, gut, kidney and liver tissues and processed them to measure the concentrations of seven metals: copper (Cu). lead (Pb), zinc (Zn), arsenic (As), cadmium (Cd), iron (Fe), and nickel (Ni). Since there is relatively little gene sequence information on brown trout, they then had to sequence, assemble and annotate transcriptome (the set of all RNA molecules [mRNA, rRNA, tRNA, and non-coding RNA]). I think you'll thank me for not going in to how they do that (if you are interested in these methods, the paper lays them out nicely), but suffice it to say it is laborious but informative. Then they performed a functional analysis for differentially expressed genes from each tissue.
When the researchers compared the metal concentrations they found all seven metals to be significantly higher in the Hayle trout than the Teign trout. Across all metals the fold change was highest in the gills (62.6-fold change) followed by the liver (33.7-fold change) then the kidney (18.5-fold change). They found no significant differences in the gut. This suggests that the gills are the primary uptake route for these metals. That makes sense considering the large surface area in direct contact with the water and the abundance of uptake carriers and transporters for these metals. After the metals are taken in by the gills, they are transported in the bloodstream to the rest of the body, accumulating in the liver and kidney. As these organs are responsible for processing, detoxification, storage and excretion it is easy to see why accumulation might happen here.
In both rivers, zinc was the most abundant metal in the gill, gut, and kidney, while copper was found to be highest in the liver. They also found zinc and copper to be the ones that increased to the greatest extent in the gills, liver and kidney. That's logical when you consider that these two metals were the ones elevated to the greatest extent between the two rivers (60- and 40-fold, respectively). They also found evidence that may link the uptake, storage and metabolism of iron, cadmium, and arsenic.
In order to identify potential mechanisms of toxicity and/or tolerance to these metals, gene expression patterns for the four selected tissues were examined in fish from both rivers. A total of 998 transcripts were differentially exposed in at least one tissue. You should expect the activity of the components involved in the body's metal homeostasis system (that ensures an adequate supply of essential [trace] metals) to change with increased metal exposure. And indeed, the researchers found at least one MT (glutathione and metallothioneins; act as buffers for metal ions entering cells and have an affinity for most metals), particularly metallothionein b, to be the most strongly up-regulated genes in the Hayle trout. This suggests that the trout's metal tolerance mechanism may be as a result of the sequestration of metals by MT. And although zinc and copper were found to be in the highest concentrations in tissues, only the zinc transporter gene was differentially expressed (down-regulated in the kidney). However, they did find changes in iron-metabolism related genes. Since metals also disrupt the balance of ions in the body causing oxidative damage, the researchers also looked at the ion homeostasis system. They found differential expression of enzymes and a number of other genes encoding proteins that are important in maintaining ion balance.
All of this put together gives some interesting mechanisms of metal toxicity, demonstrating that these fish have developed strategies for dealing with the pollution in their environment.
(image via Biopix)
Tuesday, July 3, 2012
A Lionfish of a Problem

Lionfish are beautiful but venomous. Very recently these fish have become quite a large problem in the Caribbean, the fastest invasion documented for a marine fish. The Indo-Pacific lionfish (Pterois miles and P. volitans) are native to the reefs of the Indian and Pacific Oceans. They are also very popular aquarium fish. Whether through accidental or purposeful releases in the late 1970’s through the present, lionfish have made their way into the Caribbean. It started out as not-so-bad (as such things do) with only 5 or 6 individuals, but the problem has grown (as such things do) to a self-sustaining population that reaches over 1,000 lionfish per acre in some locations. P volitans seems to have taken up all of the reef real estate south of the Bahamas, while both species can be found north of Florida extending to Bermuda and out in the Sargasso Sea. But what makes lionfish such a problem? Well, mainly their appetite. Lionfish are generalist carnivores with voracious appetites, consuming more than 56 species of fish and many invertebrates. They have evolved to food availability in the Pacific, which may be patchy, and so they eat as much as they can whenever they can. Using this appetite, they have been known to reduce their fish prey by up to 90 percent. They are capable of permanently impacting native fish reef communities across multiple trophic levels. Another problem? They have a very high rate of reproduction. Lionfish become sexually mature at about 7 months to 1 year old and spawn in pairs. Females will release 30,000 eggs every spawning cycle, adding up to about 2 million per year in some cases. These eggs settle out as baby fish in about 30-40 days. Are you doing the math? Because that’s a lot of fish and a really big invasion problem. Today I’m going to take a look at two papers (out of an ever-growing number) that ask why lionfish are successful invaders and which habitats within their invasion zone they flourish.
The first paper looks at why lionfish are successful by comparing Kenyan and Bahamian lionfish populations. This is not an uncommon type of comparison. However, it is seldom studied in marine invaders as a whole, and since marine predatory vertebrate invaders are rare it is even less common in this realm. The idea is relatively simple: Invasive species are not a problem in their home ranges, they are kept in check by other components and members of their ecosystem. Comparing invasive species to their native counterparts can reveal shifts in ecology and behavior and can shed light on the factors contributing to a successful invasion and even some potential control methods. This study tested if lionfish on invaded Caribbean reefs have reached greater abundance than they normally reach on their native reefs, and they tested potential ecological differences by measuring lionfish body size and activity levels between the native and introduced fish. To see if lionfish are in greater abundance and/or size in introduced areas, the researchers conducted underwater visual surveys of lionfish in both their native (Kenya) and introduced (Bahamas) ranges, recording numbers of fish and total length of each fish. During these surveys, they also recorded lionfish behavior as active (i.e., either hunting, swimming, hovering in the water column or moving over the substratum) or inactive (i.e., resting motionless on the substratum).
This study found that invading Bahamian lionfish reached a higher abundance than their ecological equivalent in Kenya. However, it is important to note that when they combined the density of all five Kenyan lionfish species they were similar to Bahamian P. volitans, and that some Bahamian reefs had much greater densities than others. The Bahamian lionfish were also about 50 percent longer and had an overall biomass that was 13 times higher than Kenyan equivalents or the Kenyan lionfish species assemblage. There are several hypotheses as to why including lack of exploitation, low predation, low predator diversity and abundance, low fishing pressure, and a release from congeneric competitors. They are so numerous that they now make up a significant portion of the fish biomass on invaded reefs.
The second paper looks at the progression of lionfish into different habitats. In their native range, P. volitans and P. miles are predominately found on coral, rock, and sand substrates from <1 to 50 meters underwater. Their invasive range has been observed to be much broader, extending into habitats that include reefs, seagrass, mangroves, and in depths from 1 to >600 meters of water. Two previous studies that have looked at this habitat question have found that mangroves supported higher densities of smaller-sized individuals than nearby reefs and that lionfish in seagrass were smaller than those on reefs (both suggesting a nursery function). And while there is an international effort to document the spread of the lionfish, there has been less emphasis placed on how a new location becomes colonized. This study looks the invasion history as well as this colonization. The study area was located around South Caicos (a small island in the Turks and Caicos Islands) and Long Cay (on the eastern edge of the Caicos Bank). Five different marine habitat types were distinguished: mangrove, seagrass, sheltered shallow reef, exposed shallow reef, and deep reef. Using surveys consisting of timed swims, relative density of lionfish (number of individuals seen per observer and per unit effort) was calculated within these habitat types from 2007 to 2010. To look at size frequencies of lionfish within these habitats, individuals were caught and depth, habitat, type of shelter used, and total length were recorded. The age of individuals was estimated from total size.
They found that by the end of 2010, lionfish had been observed in all five habitats with relative densities consistently rising throughout the course of the study period. Back-calculation of settlement dates indicated that lionfish may have started settling there as early as 2004. Sightings during their surveys initially showed that the density of lionfish in seagrass was 20 times higher than on deep reefs, but as the study went on the relative densities became similar across the habitat types with the concluding year showing the deep reefs to have over an order of magnitude higher lionfish density than any other habitat. There was also a significant difference in the sizes of lionfish caught in different habitats. Lionfish in deep reef habitats were significantly larger than those in seagrass and sheltered reefs, but they found no size differences in individuals from shallow habitats. Individuals found in these shallow habitats were younger than those found on deep reefs. Most of the lionfish were found to shelter on, in, under, or around other structures (corals, rocks, seawalls, trash, etc.). Observations of exposed reef habitats found lionfish to be conspicuously absent until 2010. They were found preferentially (but not exclusively) to settle in shallow habitats (seagrass, sheltered reefs, mangroves) before moving to deeper water once they had grown larger. However, they would have had to pass through these exposed reefs on their way to the deep reefs. The few individuals found on exposed reefs may be a result of this movement combined with the turbulent conditions associated with this habitat type. This evidence supports the idea that seagrass, mangroves, and sheltered shallow reef areas may serve as nursery habitats and adult fish move to deeper reef habitats later.
From all I’ve gone through today, the story looks pretty bleak. And I’ll be the first to admit that it doesn’t look optimistic. But there is good news. There are several lionfish research programs and international efforts to control or even eradicate these fish from the Caribbean (see some links below). And another bonus? Apparently they taste great!
Here are a couple of websites to get you started looking in to this problem:
CCFHR: Invasive Lionfish
REEF Lionfish Program
Interview with Chris Flock from Ocean Support Foundation
Friday, January 20, 2012
One-Third for the Birds

For this post I was looking for something a little different. Not so much a weird topic, but more like a topic that I haven't really posted on before. I came across an interesting article about predator-prey relationships as they relate to population sizes. It is one of those basic dynamics that is taught in almost every biology and/or ecology class there is, and rightfully so, because when you get down into it it is actually pretty interesting, no to mention really important.
Most people think they know predator-prey relationships. One thing eats another thing. The organism doing the eating is the predator and the one that is eaten the prey. That is perfectly true. Now think about it in terms of evolution. The predator and the prey evolve together, what is usually referred to as the "evolutionary arms race." If the predator does not catch any food then it does not survive; those that evolve better ways to catch food survive (speed, stealth, smell, sight, etc.). If the prey gets caught by the predator then it (obviously) does not survive, and so it evolves better ways to evade predators (camouflage, speed, poison, etc.). It is important to point out that both the predator and they prey are both adapting, a type of co-evolution. Next, think about the system in terms of population. The interaction of predators and prey greatly affect their population sizes, often on several levels within the food chain/web (or tropic pathway/cascade). When predators eat prey they: (1) decrease the population size of the prey, (2) survive, thereby not decreasing their own population, and (3) are healthy, and alive, enough to breed additional predators, increasing their population. So when there are lots of predators you see a big dip in the size of the prey population. You will can make the same types of conclusions when you take the point of view of the prey. When prey is eaten by the predator: (1) they are removed from the population, decreasing population size, (2) are no longer healthy and alive to reproduce, (3) release their food source (if there is one) to increase their population, and (4) by decreasing their population there is that much less food for their predators. These interactions can result in very predictable, natural boom and bust cycles within these populations and is more the focus of today's topic. If you want pictures and graphs then check out the classic lynx-hare relationship and the Lotka-Volterra Model.
A new paper published in Science takes a look at the role of top predators in marine ecosystems. These upper tropic level (UTL) species include seabirds, marine mammals, and large predatory fish. All groups that have been depleted due to human activities. Fisheries impacts cause direct mortality in the targeted species and indirect, often more subtle, mortality lower down in the food chain/web. Fisheries that specifically target lower tropic level (LTL) species (small fish, squid, crustaceans, etc.) threaten those higher tropic level species by directly removing their food sources. However, it can be very challenging to assess the impacts of fishing on food webs, an ecosystem level approach. Think about it: all those predator-prey interactions in the ocean. That's tough. Often what you see is studies, even large ones, taking on a big chunk of the system, modeling how it works based on gathered data, and drawing conclusions or feeding it into an even bigger model. This study in Science specifically looks at seabirds.
 | |
| Figure 1: A map of the distribution of seabird and prey species. (click for larger view) |
They found something that you usually don't see when you crunch that much data - all their species showed the same response. The results showed that the number of fledglings per breeding pair started to decline and was more variable when their forage fish food source dropped below one third of its maximum observed amount. The prey becomes scarce and as a result the hunting becomes more inefficient. The birds do not have enough food to successfully raise that many young.
Sure, there are the normal high and low cycles that I mentioned at the beginning, and those are natural. However, adding high rates of fishing from humans into it and, as with many other systems, we exacerbate the problem or collapse the system completely. The fish populations never recover from low seabird numbers because predation and habitat destruction by humans still puts a large amount of pressure on the fish, causing chronic food scarcity for the birds. And, as this study shows, this scarcity can have long-term affects on breeding success, can reduce survival in adult birds, and may affect the trajectory of their populations. The thresholds revealed by this study should inform management objectives in balancing predator-prey interactions, a "keep one-third for the birds" approach. If done well, these management decisions can sustain healthy UTL predator populations, maintain LTL fish populations, and could be applied to other marine ecosystems.
Read the paper here:
Philippe M. Cury, et al. (2011) Global seabird response to forage fish depletion -- One-third for the birds. Science: 334(6063), 1703-1706. (DOI: 10.1126/science.1212928)
And a write-up in ScienceNOW called "A Surprising Threshold for Seabird Survival"
Learn more about predator-prey interactions at
University of Michigan's Introduction to Global Change Curriculum's "Trophic Links: Predation and Parasitism"
New England Complex Systems Institute (NECSI)'s Predator-Prey Relationships page
University of Wisconsin-Madison's SSCC page on Predator-Prey Models (Warning: Contains potentially scary math)
A neat demo from Wolfram of a Predator-Prey Model of foxes and rabbits
Also, revisit my post called "To Eat or Not to Eat, That is the Fishy Question" to learn more about how to purchase seafood from green stores or restaurants and guides on choosing the correct seafood.
(image from readysetwhoa.wordpress.com)
Wednesday, October 19, 2011
To Eat or Not to Eat, That is the Fishy Question

I love seafood as much as the next person...well, ok, probably more. It is a healthy and delicious food source, but there is a limit to the fish in the sea. We tend to think of ocean fish and shellfish as just food on our plates, but they are wildlife. Wildlife that we hunt on a very large scale.
Humans have been fishing the oceans for thousands of years, but within the last half century technology has developed such that we are able to fish farther, deeper, and more efficiently. As such, more than 70 percent of the world's commercial marine fish stocks are either fully exploited, overfished, or have collapsed. Add to that illegal fishing, habitat damage, and bycatch and you have a serious worldwide problem. Over the past few decades aquaculture, or fish farming, has become an increasingly popular solution to the increasing pressures on marine resources. In fact, today, half of our seafood comes from farms. However, the ecological impact of farming depends on the species raised, the farm location, and how the animals are raised. What does that mean? Well, some species are easier to raise than others, some farms are closed-systems where wastes are controlled, some farms have higher escape rates which threaten native species with diseases, and some farms feed a vegetable- or soy-based diet while others feed with wild caught fish.
Alright, well, that's pretty bleak right? So what can you, the single lowly consumer, do about it? Actually, that is pretty simple. Ask questions and watch what you eat. First, there are a few ocean-friendly steps that you can take:
 1. Purchase seafood from a green (or if unavailable, yellow list) or look for the Marine Stewardship Council blue eco-label in stores and restaurants. (see below about where to get and how to read seafood guides)
2. When you buy seafood, ask where it comes from and if it is farmed or wild-caught. Most reputable markets will label their fish. However, some stores and restaurants only give generic names and catch locations for their fish. Ask anyway and tell them why you care, it may prompt them to look into it. An alternative is to buy seafood through online retailers, such as EcoFish.com, who feature sustainable species and deliver right to your home.
3. Spread the word. The more people practicing safe seafood the better.
Seafood guides are a free and easy way to help you choose the right seafood. In general, the lists are broken up into three colors:
- Green (Best) - abundant, well-managed and caught or farmed in environmentally friendly ways.
- Yellow (Good/OK) - an alternative to green but there are mixed records on how they are managed, the health of their habitat, or how they are caught or farmed.
- Red (Avoid/Worst) - have one or more serious environmental problems such as overfishing, poor management, high bycatch, extensive habitat damage, or come from farms that allow widespread pollution, spread disease, use chemicals, or have a high escape rate.
Monterey Bay Aquarium Seafood Watch
This is the best website I have found for information, guides, searches, and links.
Environmental Defense Fund's Seafood Selector
This is a great website that includes a lot of information about each of the species on each of the three lists. They also include great, free, downloadable guides.
Blue Ocean Institute's Seafood Page
This website includes a great FAQ page as well as a seafood and sushi guide.
Natural Resources Defense Council's Sustainable Seafood Guide
This guide delves more into the topic of contaminated seafood but includes a shopping guide, recipes, and health alert information.
Marine Stewardship Council
Find out what MSC products are available in your country. Find out about what it takes to get a product certified and even track a fishery.
Marine Conservation Society - FISHONLINE website
This is for you U.K. folks. You can search for a fish, get fish ratings and lists, get information on fishery/production areas and methods, and download seafood guides.
Australian Marine Conservation Society
This one is for the Aussies. They include all the information you could want about your oceans. There are downloadable seafood guides and also an iPhone app!
WWF Sustainable Seafood Consumer Guides
Not in the U.S., the U.K, or Australia? Not a problem. Check out the World Wildlife Fund's list of worldwide seafood guides. The is a link to your country's web page with link to download a seafood guide PDF. While you are there (no matter your country of origin) check out their information on fisheries and sustainable seafood.
End of the Line
This is the world's first major documentary about the effects of overfishing. It premiered at the Sundance Film Festival this year and is now out on DVD. Go to their website to watch the trailer, find or organize a screening, order a DVD, and/or find links for guides.
(image from envirothink.wordpress.com)
Thursday, June 9, 2011
The Sleep of the Blind Fish

This is a story about sleep. It is also a story about blindness. Do the blind sleep more or less than the sighted? Is that a result of having no sight, a result of the environment, a genetically controlled characteristic, or a little bit of everything? Today's post involves a study about sleep in fish.
Astyanax mexicanus is a characin fish commonly known as the Mexican cave fish or Mexican tetra, and it occupies a wide variety of freshwater habitats within both it's native range and naturalized range. They are typically carnivorous, but has also been reported to be omnivorous in some parts of it's range. The species has a characteristic adipose fin, a strongly compressed body, a relatively small number of scales on the lateral line, and is approximately 12 cm (4.7in) long. Most notably, it has two forms: the normal form and the blind cave form. The blind cave form is albino with no eyes. The embryos are sightless and as the animal ages the organs decay and the eyes are scaled over. They live in the freshwater pools or streams deep within caves where no light penetrates. As such, they have lost their eyes, but are able to navigate using their lateral lines, which are highly sensitive to fluctuating water pressure. This is a pretty common pattern that you see in cave dwellers worldwide. They tend to converge on a suite of traits including eyelessness, loss of pigmentation, metabolic changes, and changes in feeding behavior. This type of convergence on traits in unrelated lineages is called convergent evolution.
A new study published in Current Biology takes a look at both blind and normal A. mexicanus populations. There are numerous cave populations known that are largely independent in their origins. This makes this fish ideal for studying the genetic basis of convergent evolution. Additionally, ecological conditions change as you go from surface to cave and this change is likely to have an impact on the fishes' sleep. This makes the fish good for studying the variability in patterns of sleep.
The researchers reared fish collected from isolated, blind cave populations in Pachon, Tinaja, and Molino as well as surface sighted fish. The Pachon and Tinaja populations are derived from the same ancestral stock but are geographically distant and hydrologically isolated by surface and subsurface drainage divides. The Molino population is derived from a different stock than the Pachon and Tinaja and is also isolated. Hybridization experiments were conducted where each population of fish was mated to each of the other populations of fish to create F1 hybrids (first cross/generation). They also reared an F2 (the following generation, mated F1's), and backcross (a hybrid to the original/wildtype) hybrids. Then the researchers tested whether or not a fish could see (just having eyes doesn't mean you can see out of them). To do this they immobilized a fry (recently hatched fish), placed them in a cylinder that flashed alternating patterns of black and white stripes, and watched to see if their eyes moved according to the color divisions. Eye movement equals sight. Gene assays were run to assess the complemation of the genes between populations. Then they developed an assay to characterize sleep in the F1, F2, and backcross hybrids.
In the inital crosses they found that, in some cases, the F1's could see. They found that the genetic mutations causing blindness are different in different lineages of fishes. So, why the restoration of sight as quickly as one generation? That is because populations from different caves are blind for different reasons. That means that in each population a different set of genes is nonfunctional, causing the blindness. Even though the fish were blind they still had basic functional visual systems, they had just been deactivated. The activated genes in the normal fish were able to overcome the inactivated genes of the blind fish. Interestingly, this relationship was stronger in populations that were more geographically distant from one another. The more distant the populations the less overlap in blindness-causing genes. The genetics results showed that the three cave populations also converged on the phenotype of reduced sleep.
So they then conducted a few sleep experiments:
1. They tested the threshold of arousal after inactivity they measure the responsiveness of a fish to repeated mechanical stimulus. Basically, they wait until the fish falls asleep (they stop moving, sink to the bottom of the tank, and drop their tail), wait a certain period of time, and they try to wake them up by tapping on the tank.
2. They tested if the fish were really sleeping by depriving them of sleep for one night and measuring their level of activity the next day.
3. They tested the day and night cycles by simulating them in alternating 12-hour light and dark periods.
4. From their breeding experiments, they looked at the sleep duration and cycles of the hybrids. This would give a genetic link to the sleep habits.
In the first, wake-the-fish-up, experiment they found that both surface and cave fry transitioned toward a higher wake up threshold as the period of inactivity increased. Once the fish had been inactive for 60 seconds it was in a different state entirely (it was sleeping) and it took more taps on the tank to wake them up. The second, keep-the-fish-awake, experiment found that all of the sleep deprived fish were less active the next day, and that depriving a fish of sleep is a good way to induce subsequent sleep behavior. A sleep rebound, if you will. The third, lights-on-lights-off-cycle, experiment found that the three populations of cave fish slept significantly less (110-250 min/day) than the surface fish (800 min/day). This is probably because the cave fish are in dark environments all the time while on the surface the light and dark cycles are tied to food availability and predator activity. So surface fish have a greater need to be attuned to light/dark cycles than do cave fish. The fourth, hybrid-sleep, experiment showed that the F1's slept like the cave fish. This indicates that the gene for less sleep is dominant. The F2 generation showed an intermediate sleep behaviors. Put these two results together and it suggests that sleep is controlled by a few specific genes.
Overall, a pretty cool experiment. Kinda reminds me of how I sleep. Which, ultimately was the purpose of the study - to equate fish sleep patterns and genetic control to human patterns and genes.
Yawn. Kinda makes me want to take a nap.
Here is the paper:
Duboué, Eric R., Alex C. Keene, Richard L. Borowsky. (2011) Evolutionary Convergence on Sleep Loss in Cavefish Populations. Current Biology: 21(8), 671-676. (DOI: 10.1016/j.cub.2011.03.020)
And here are a few story links:
http://news.nationalgeographic.com/news/2008/01/080108-cave-fish_2.html
http://news.discovery.com/animals/blind-cavefish-dont-snore-110411.html
http://www.sciencedaily.com/releases/2011/04/110407121322.htm
http://www.wired.com/wiredscience/2011/04/insomniac-cavefish/
(image via the Wired story linked above)
Sunday, May 22, 2011
Fishy Codependency
Angler fish belong to the order Lophiiformes. They are deep sea fish named for their unique way of luring in their prey. They have a long filament that extends from the top of their head, near the eyes and mouth, that is movable (some even have tips that can light up!) and so can be wiggled to imitate prey. It acts as bait to bring in smaller creatures, like a fishing lure, and when the curious, hungry critter gets close the angler fish strikes. The topic of today's post, inspired by the comic below from The Oatmeal, is about angler fish reproduction. Some angler fish, particularly the Ceratiidae, have one of the most unusual matings systems you'll find in the animal kingdom.
This story is completely true.
(click on comics for a larger view)


(Comic via The Oatmeal)
Some additional internet sources on angler fish:
Tuesday, April 5, 2011
Cleaning Station Alpha
You're a large wild animal. You itch. You scratch. You attract little critters that you can't reach. What do you do?
You are a small wild animal. You search. You hunt. You need to find those juicy morsels to keep your little belly full. What do you do?
Ectoparasites are any parasites that live on the exterior of another organism. They are pests and can be nuisances and detrimental effects for large animals. However, a mutualism has evolved between large pest-riddled animals and smaller organisms which feed on these pests. You are probably familiar with pictures of small birds sitting on large mammals. These birds get the benefit of an ectoparasite meal and the large mammal gets the benefit of no ectoparasites. But did you know that this type of mutualism doesn't just exist in terrestrial ecosystems?
 A wide variety of small marine organisms clean external parasites (and dead skin) from other marine organisms (clients), typically other fish. These cleaners include wrasses, gobies, shrimp, cichlids, etc. Some species of cleaners will even set up a cleaning station where client fish stop in, partake of the cleaning service, and then swim away. Studies have shown that reef fish will actively visit cleaner fish to have parasites and dead or infected tissue removed. These studies typically investigate the station itself, including which species sets it up and which species partake of its services, or the behavior of the fish at the station, what keeps the cleaner fish honest and not taking little bites of healthy client tissue. There have also been several studies in various systems that have failed to show, quantitatively, any benefit to the clients, suggesting that cleaner fish are "behavioral parasites." In other words, they exploit the sensory system of the clients to obtain food, they do not increase the fitness of the client.
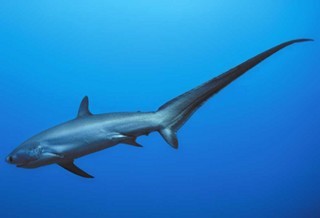
A new(ish) paper in the journal PLoS ONE investigates the interaction of cleaners and pelagic shark species at a seamount. Seamounts are hotspots of biodiversity in the open ocean, acting as stepping-stones for marine species to spawn and dispense their larvae. They also serve as important habitats for visiting large marine vertebrates, such as sharks, potentially acting as social refuges. This study looks at the pelagic thresher shark (Alopias pelagicus). This shark reaches 12 feet (365 cm) long, most of which is a long tail fin, and inhabits warm and temperate offshore waters circumglobally. It is known that sharks that are infected with ectoparasites suffer from a variety of health consequences including anaemia, retarded reproductive organ development, reduced respiratory efficiency, debilitating skin disease, and infections. Therefore, it is likely that visiting a cleaning station would be beneficial to the sharks.

This paper quantified the behavioral interactions between pelagic thresher sharks and cleaner wrasse to test if cleaners selectively forage on specific areas of shark clients and if shark clients modify their behavior to facilitate inspections from the cleaners. The researchers sampled fish at the Monad Shoal, in the Visayan Sea, due east from Malapascua Island, Cebu, in the Philippines. It is a seamount that rises 820 feet (250 m) from the sea floor with the top forming a plateau at 50 to 65 feet (15 to 25 m) depth. They selected five cleaning stations and set up remote video cameras to observe the behaviors of the fish. They identified the areas, or "patches," of a shark's body known to harbor high concentrations of parasites to see which patches the cleaners were inspecting the most. They categorized the behaviors in order to differentiate the behavioral patters of the sharks while they interacted with the cleaners including swim speeds and direction of locomotion and posing patterns.
The researchers found that the cleaners showed preferences for foraging on specific patches of a sharks' bodies with the highest percentages of inspections occurring on the pelvis, pectoral fins, and caudal fin. These results, particularly the high concentration of cleaning in the pelvic region, likely reflect the distribution of ectoparasites on the bodies of the sharks. There was no preference for time of day or shark sex, but there was a positive correlation between the amount of time a shark spent at a cleaning station and the number of inspections it received. The authors suggest that sharks that spent more time at a cleaning station harbored more ectoparasites. A head-stand or tail-stand posing behavior is classic to reef fish clients at cleaning stations that act as signals to solicit a cleaning interaction, but require fish to pump their gills or lie still to be cleaned. However, the thresher shark, like most oceanic sharks, is what is called an obligate ram ventilator, meaning that it must constantly swim to maintain oxygen ventilation, or to "breathe." To get around this problem and still advertise they they want the cleaning service the sharks performed a behavior called "circular-stance-swimming." The shark slows its routine swim speed while assuming a head-up swimming attitude and lowering of the caudal fin and then performs slow circular swims in/around the cleaning station.
This study suggests that cleaner wrasse play an important part in the structure of seamount communities. The cleaners show selective behavior in cleaning high parasite areas which may make them more attractive to the clients. Pelagic thresher sharks regularly visit the cleaner stations and even modify their behavior to facilitate cleaning. Overall, a very interesting interaction.
Here is the paper - and it is from PLoS ONE so it is free!
Oliver, Simon P., Nigel E. Hussey, John R. Turner, and Alison J. Beckett. (2011) Oceanic sharks clean at coastal seamount. PLoS ONE: 6(3), e14755. (DOI: 10.1371/journal.pone.0014755)
(images from reefguide.org and , respectively)
You are a small wild animal. You search. You hunt. You need to find those juicy morsels to keep your little belly full. What do you do?
Ectoparasites are any parasites that live on the exterior of another organism. They are pests and can be nuisances and detrimental effects for large animals. However, a mutualism has evolved between large pest-riddled animals and smaller organisms which feed on these pests. You are probably familiar with pictures of small birds sitting on large mammals. These birds get the benefit of an ectoparasite meal and the large mammal gets the benefit of no ectoparasites. But did you know that this type of mutualism doesn't just exist in terrestrial ecosystems?

A new(ish) paper in the journal PLoS ONE investigates the interaction of cleaners and pelagic shark species at a seamount. Seamounts are hotspots of biodiversity in the open ocean, acting as stepping-stones for marine species to spawn and dispense their larvae. They also serve as important habitats for visiting large marine vertebrates, such as sharks, potentially acting as social refuges. This study looks at the pelagic thresher shark (Alopias pelagicus). This shark reaches 12 feet (365 cm) long, most of which is a long tail fin, and inhabits warm and temperate offshore waters circumglobally. It is known that sharks that are infected with ectoparasites suffer from a variety of health consequences including anaemia, retarded reproductive organ development, reduced respiratory efficiency, debilitating skin disease, and infections. Therefore, it is likely that visiting a cleaning station would be beneficial to the sharks.
This paper quantified the behavioral interactions between pelagic thresher sharks and cleaner wrasse to test if cleaners selectively forage on specific areas of shark clients and if shark clients modify their behavior to facilitate inspections from the cleaners. The researchers sampled fish at the Monad Shoal, in the Visayan Sea, due east from Malapascua Island, Cebu, in the Philippines. It is a seamount that rises 820 feet (250 m) from the sea floor with the top forming a plateau at 50 to 65 feet (15 to 25 m) depth. They selected five cleaning stations and set up remote video cameras to observe the behaviors of the fish. They identified the areas, or "patches," of a shark's body known to harbor high concentrations of parasites to see which patches the cleaners were inspecting the most. They categorized the behaviors in order to differentiate the behavioral patters of the sharks while they interacted with the cleaners including swim speeds and direction of locomotion and posing patterns.
The researchers found that the cleaners showed preferences for foraging on specific patches of a sharks' bodies with the highest percentages of inspections occurring on the pelvis, pectoral fins, and caudal fin. These results, particularly the high concentration of cleaning in the pelvic region, likely reflect the distribution of ectoparasites on the bodies of the sharks. There was no preference for time of day or shark sex, but there was a positive correlation between the amount of time a shark spent at a cleaning station and the number of inspections it received. The authors suggest that sharks that spent more time at a cleaning station harbored more ectoparasites. A head-stand or tail-stand posing behavior is classic to reef fish clients at cleaning stations that act as signals to solicit a cleaning interaction, but require fish to pump their gills or lie still to be cleaned. However, the thresher shark, like most oceanic sharks, is what is called an obligate ram ventilator, meaning that it must constantly swim to maintain oxygen ventilation, or to "breathe." To get around this problem and still advertise they they want the cleaning service the sharks performed a behavior called "circular-stance-swimming." The shark slows its routine swim speed while assuming a head-up swimming attitude and lowering of the caudal fin and then performs slow circular swims in/around the cleaning station.
This study suggests that cleaner wrasse play an important part in the structure of seamount communities. The cleaners show selective behavior in cleaning high parasite areas which may make them more attractive to the clients. Pelagic thresher sharks regularly visit the cleaner stations and even modify their behavior to facilitate cleaning. Overall, a very interesting interaction.
Here is the paper - and it is from PLoS ONE so it is free!
Oliver, Simon P., Nigel E. Hussey, John R. Turner, and Alison J. Beckett. (2011) Oceanic sharks clean at coastal seamount. PLoS ONE: 6(3), e14755. (DOI: 10.1371/journal.pone.0014755)
(images from reefguide.org and , respectively)
Thursday, November 11, 2010
I'm Bringin' Stickleback
I just love sciency song parodies. Here's a "Sexyback" parody about sticklebacks. Awesome.
Thursday, October 14, 2010
Flashy Fins
 |
| Figure 1: X-ray image of Pelvicachromis taeniatus |
"When it comes to sexual selection in the animal world, it is the usually the sex that puts more effort (and has more to lose) into the results that gets to be the choosy sex. Usually this means females get to be picky. After all, eggs are more expensive than sperm and females often end up contributing quite a bit with parental care. This choosiness means that males need to impress females through the evolution of secondary sexual traits. This could be, and usually is, just about anything: elaborate feathers, complicated dances or mating calls, gift giving, etc."
So what happens when you see a highly developed ornament on a female of a species? Usually such ornaments are seen as non-adaptive, they are simply the genetic correlations of male ornaments. But, if you go back to the who "gets to be the choosy sex" argument and apply it to females you may find that females are looking to attract males that give them something that they need in addition to a sperm contribution. Perhaps the male takes care of the female (or "invests in female quality"), or maybe he contributes a significant amount of parental investment (or he's a good baby-daddy). This idea of females evolving ornaments to attract males has gained some ground recently. And that topic is today's article.
There is a species of cichlid fish called Pelvicachromis taeniatus where both sexes have ornamentation. This fish is known to be biparental and socially monogamous. Both sexes develop large, colored pelvic fins that they present to their potential mates during courtship. The pelvic fin of female fish is exceedingly large and differs from the male fin in both color and shape (it is triangular rather than thread-shaped). During courtship, females spread out their violet, triangular pelvic fin and fan it at the males. This behavior enlarges "their violet ventral nuptial projection area," suggesting that the fin and behavior are used to attract males. This study took a look at the allometric relationship of the pelvic fin compared to other fins (anal, caudal, dorsal, and pectoral fin), and then tested male preferences for females showing larger or smaller pelvic fins to determine the effect of fin size on male mate choice.
I would be remiss and probably confuse the heck out of you if I didn't take a sentence, or a few, to explain allometry. The most basic of basic definitions is that allometry is the relationship between size and shape. You define the dimensions of a body part (or trait or character) in relation to the body size, with the scale relating trait size to body size. What you get is an allometric relationship, and these are typically classified in three ways:
(1) Isometry - the ratio of trait to body size is constant
(2) Negative Allometry - large individuals have small traits
(3) Positive Allometry - large individuals have relatively larger traits
This relationship is driven by evolutionary constraints, natural selection, and/or sexual selection. And when you look at those traits driven by sexual selection you usually see option (3) Positive Allometry. Although a positive allometry does not mean the trait was driven by sexual selection.
In the experiment, the researchers took X-ray images of the females so they could analyze trait and body size. Then they conducted mate choice experiments to see which female characters the males preferred. Typically this is achieved by putting a female fish in one tank and a male fish in an adjacent tank and observing the courtship or lack of. Then the trait of interest can be altered (fin clipping, etc) or a substitute used. In this case the researchers used computer animations of females with various pelvic fin sizes. The use of the computer allowed them to standardize the stimuli and eliminate many confounding variables.
The allometry study found that the female pelvic and caudal fins showed isometry in relation to body size, but the anal, dorsal, and pectoral fins showed negative allometry. The females showed a constant ratio of pelvic or caudal fin size to body size, but the other fins were relatively smaller in larger females. They also found that the size of the pelvic and caudal fin is more positively related to body size than the other fins, suggesting that these fins are under selective pressures that the other fins are not. Remember when I said that sexually selected traits usually show positive allometry? This study showed isometry and negative allometry, no positive. The authors hypothesize that when you incorporate viability selection you end up with a more complex relationship between body size and traits, that natural selection and sexual selection "could have synergistic effects on the evolution of traits, thus sexually selected traits may be scaled into isometry or even negative allometry." Perhaps the amount of variation in traits under directional sexual selection may be limited by natural selection, that natural selection is constraining the pelvic fin size of these fish. Basically, a gigantic fin attracts a mate but slows you down and makes it easier for predators to get you. So you find a middle ground, a fin that isn't too big and gets you eaten but isn't too small so that you never attract a mate. This scaling down for the predators is where the isometry and negative allometry are showing themselves.
The mate choice experiment showed that males like large pelvic fins. But why? Could be that the large fin is an indicator to female quality. These indicators may be direct (fertility, fecundity, or maternal investment) or indirect (genetic benefits, parasite resistance, pretty daughters). Translated - If she can carry around that big fin and survive then she must have good behaviors and genes. The researchers found pelvic fin size in females to be positively related to body condition. So it is likely that the indicators are reliable. I haven't discussed much about the violet color of the female pelvic fin, but the fins are colored similar to the ventral violet nuptial belly coloration. The size of this ventral coloration is associated with female quality, indicating the fecundity of the female, her readiness to spawn, and may reveal information about her maternal quality and offspring survival rates. Again, all indicators that tell the male that she's quite a catch (no pun intended).
Anyone who has spent time with a group of females (of any species) knows that there's some competition going on, and you can't rule that out in a study such as this. These cichlid fish show sequential aggressive behaviors towards other females. Before a fight escalates a female will present and fan out her pelvic fin to show off her body condition and body size in the hopes of intimidating and driving off the rival female.
When it comes to fish studies, especially sexual selection studies, there are many. This study is unique in that it is the first to show that male choice might scale the allometry of a female sexual trait. This is important in understanding the scaling relationship of female traits with body size and starting to tease out the selection pressures driving the evolution of these ornaments.
Read the study here:
Baldauf, Sebastian A., et al. (2010) Male mate choice scales female ornament allometry in a cichlid fish. BMC Evolutionary Biology: 10, 301. (DOI: 10.1186/1471-2148-10-301)
Subscribe to:
Posts (Atom)